In der sich stetig wandelnden Einzelhandelslandschaft stehen stationäre Händler vor einer Vielzahl an Herausforderungen. Von der wachsenden Konkurrenz durch den E-Commerce über sich veränderndes Konsumverhalten bis hin zu steigenden Betriebskosten: Wer erfolgreich bleiben will, braucht innovative Lösungen. Ein besonders wirkungsvolles Werkzeug, mit dem Händler diese Herausforderungen direkt angehen können, ist Customer Journey Mapping im Geschäft. Indem die Customer Journey kartiert und jeder Touchpoint analysiert wird, gewinnen Händler wertvolle Erkenntnisse, um das Einkaufserlebnis im Geschäft zu verbessern. In diesem Beitrag betrachten wir die fünf größten Herausforderungen für Einzelhändler und zeigen, wie Customer Journey Mapping diese wirkungsvoll bewältigen kann.
Herausforderung 1: Konkurrenz durch den E-Commerce

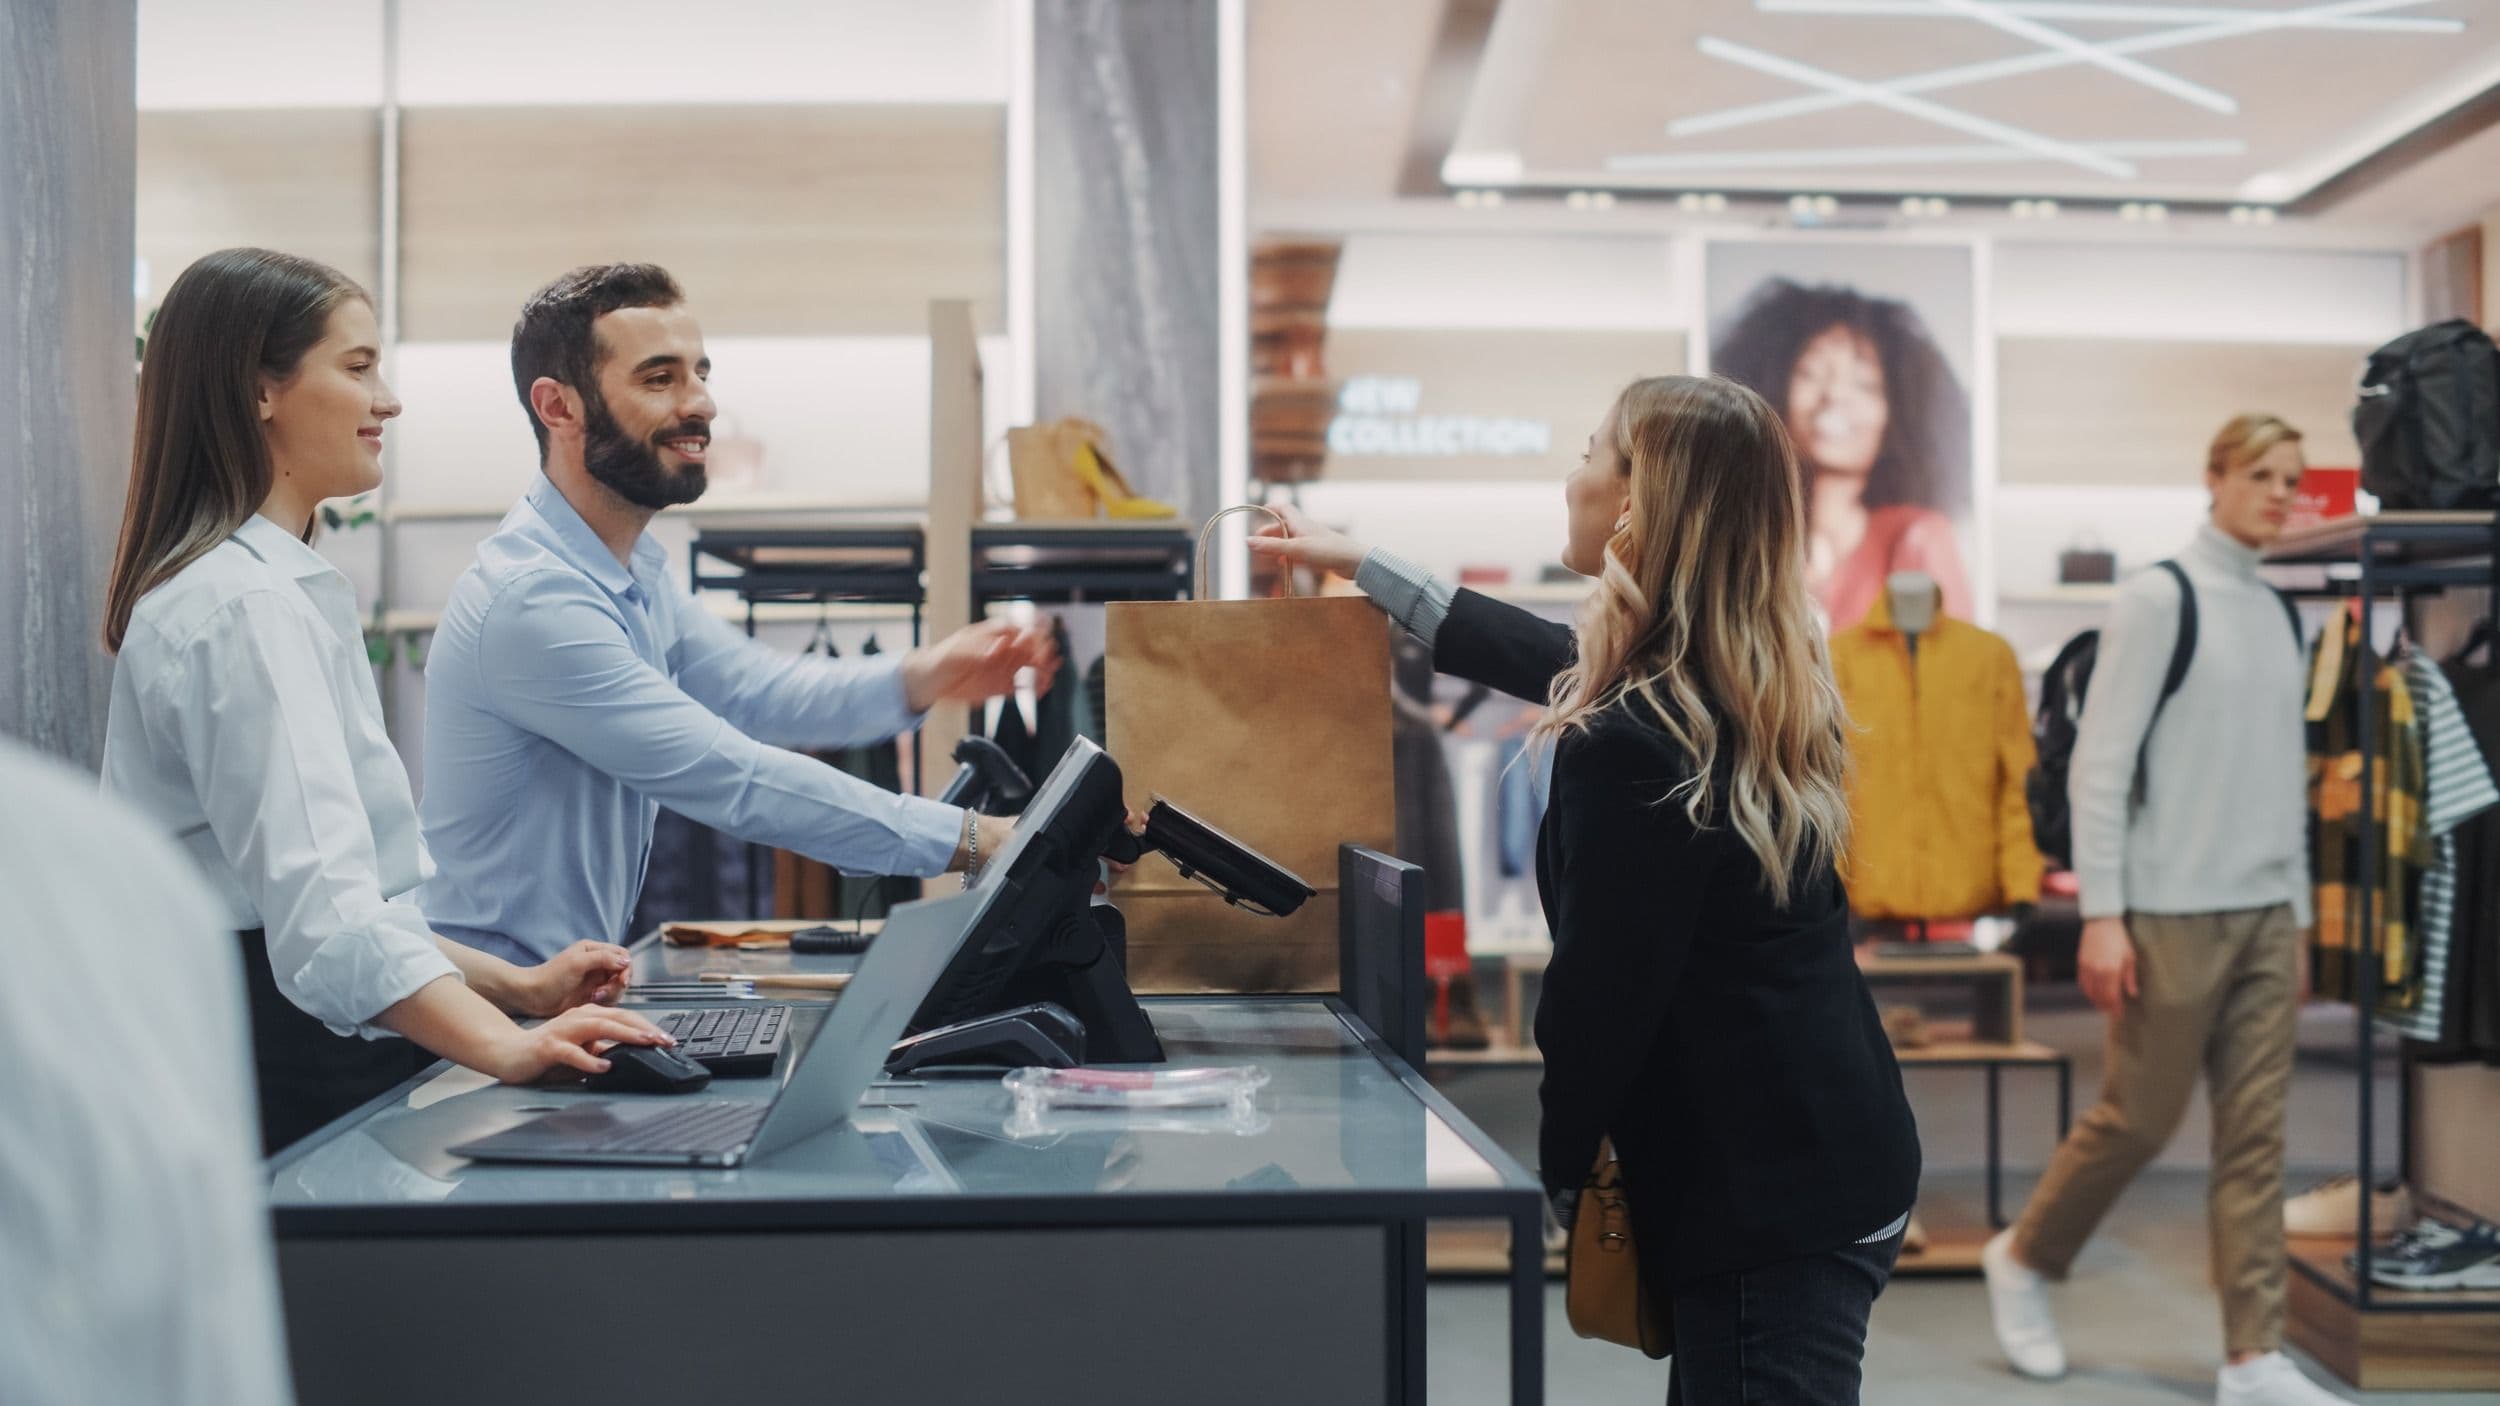
In einem digitalen Zeitalter, das vom Online-Shopping geprägt ist, stehen stationäre Händler in scharfem Wettbewerb mit E-Commerce-Giganten. Customer Journey Mapping eröffnet jedoch einen Weg zum Erfolg. Indem Händler die Customer Journey in ihren physischen Filialen abbilden, lassen sich Schwachstellen und Bereiche identifizieren, in denen das Einkaufserlebnis im Geschäft verbessert werden kann. Entscheidend ist es zu verstehen, was das physische Geschäft von seinem Online-Pendant abhebt. Händler können sich auf persönliche Interaktionen, fachkundiges Personal und immersive Erlebnisse konzentrieren, die für Kundinnen und Kunden unvergessliche Momente schaffen. Mithilfe der Erkenntnisse aus der Customer Journey können Händler einzigartige Wertversprechen formulieren und sich klar vom Online-Wettbewerb abgrenzen.
Herausforderung 2: Sich wandelndes Konsumverhalten

Konsumverhalten und Präferenzen entwickeln sich ständig weiter und stellen den klassischen Handel vor Herausforderungen. Wir sehen mehr zeitknappe Käufer, mehr innovationsorientierte Kundinnen und Kunden und in bestimmten Regionen ein starkes Wachstum bei einkommensstarken, kaufkräftigen Zielgruppen. Customer Journey Mapping ermöglicht es Händlern, sich an diese veränderten Kundenprofile und deren Erwartungen anzupassen. Durch die Analyse jedes Touchpoints in der Customer Journey können Händler erkennen, an welchen Stellen Anpassungen nötig sind, um Schritt zu halten. Dazu gehört, Filiallayouts zu optimieren, das Visual Merchandising zu verbessern und Service-Interaktionen aufzuwerten, etwa durch die Integration mobiler Apps für personalisierte Empfehlungen oder Abholoptionen im Geschäft für Online-Bestellungen. Wer die Erwartungen entlang der gesamten Customer Journey versteht und erfüllt, baut Kundenbindung auf und sichert Folgekäufe.
Herausforderung 3: Steigende Betriebskosten
Der Betrieb eines stationären Geschäfts bringt vielfältige Kosten mit sich, die die Profitabilität belasten, besonders bei rückläufigen Besucherzahlen. Customer Journey Mapping hilft Händlern, Betriebskosten zu optimieren, indem ineffiziente Bereiche identifiziert werden. Durch die Analyse der Besucherströme im Geschäft lassen sich Filiallayouts anpassen, Laufwege verbessern und Betriebskosten reduzieren. Schlankere Prozesse, etwa an Kasse und Retoure, verbessern das Einkaufserlebnis und steigern gleichzeitig die betriebliche Effizienz. Der Einsatz von Technologien wie Self-Checkout oder mobilem Bezahlen kann Abläufe weiter vereinfachen und Kosten senken. Indem Ineffizienzen mit Customer Journey Mapping aufgedeckt und beseitigt werden, finden Händler ein Gleichgewicht zwischen Betriebskosten und einem reibungslosen Einkaufserlebnis im Geschäft.
Herausforderung 4: Omnichannel-Integration
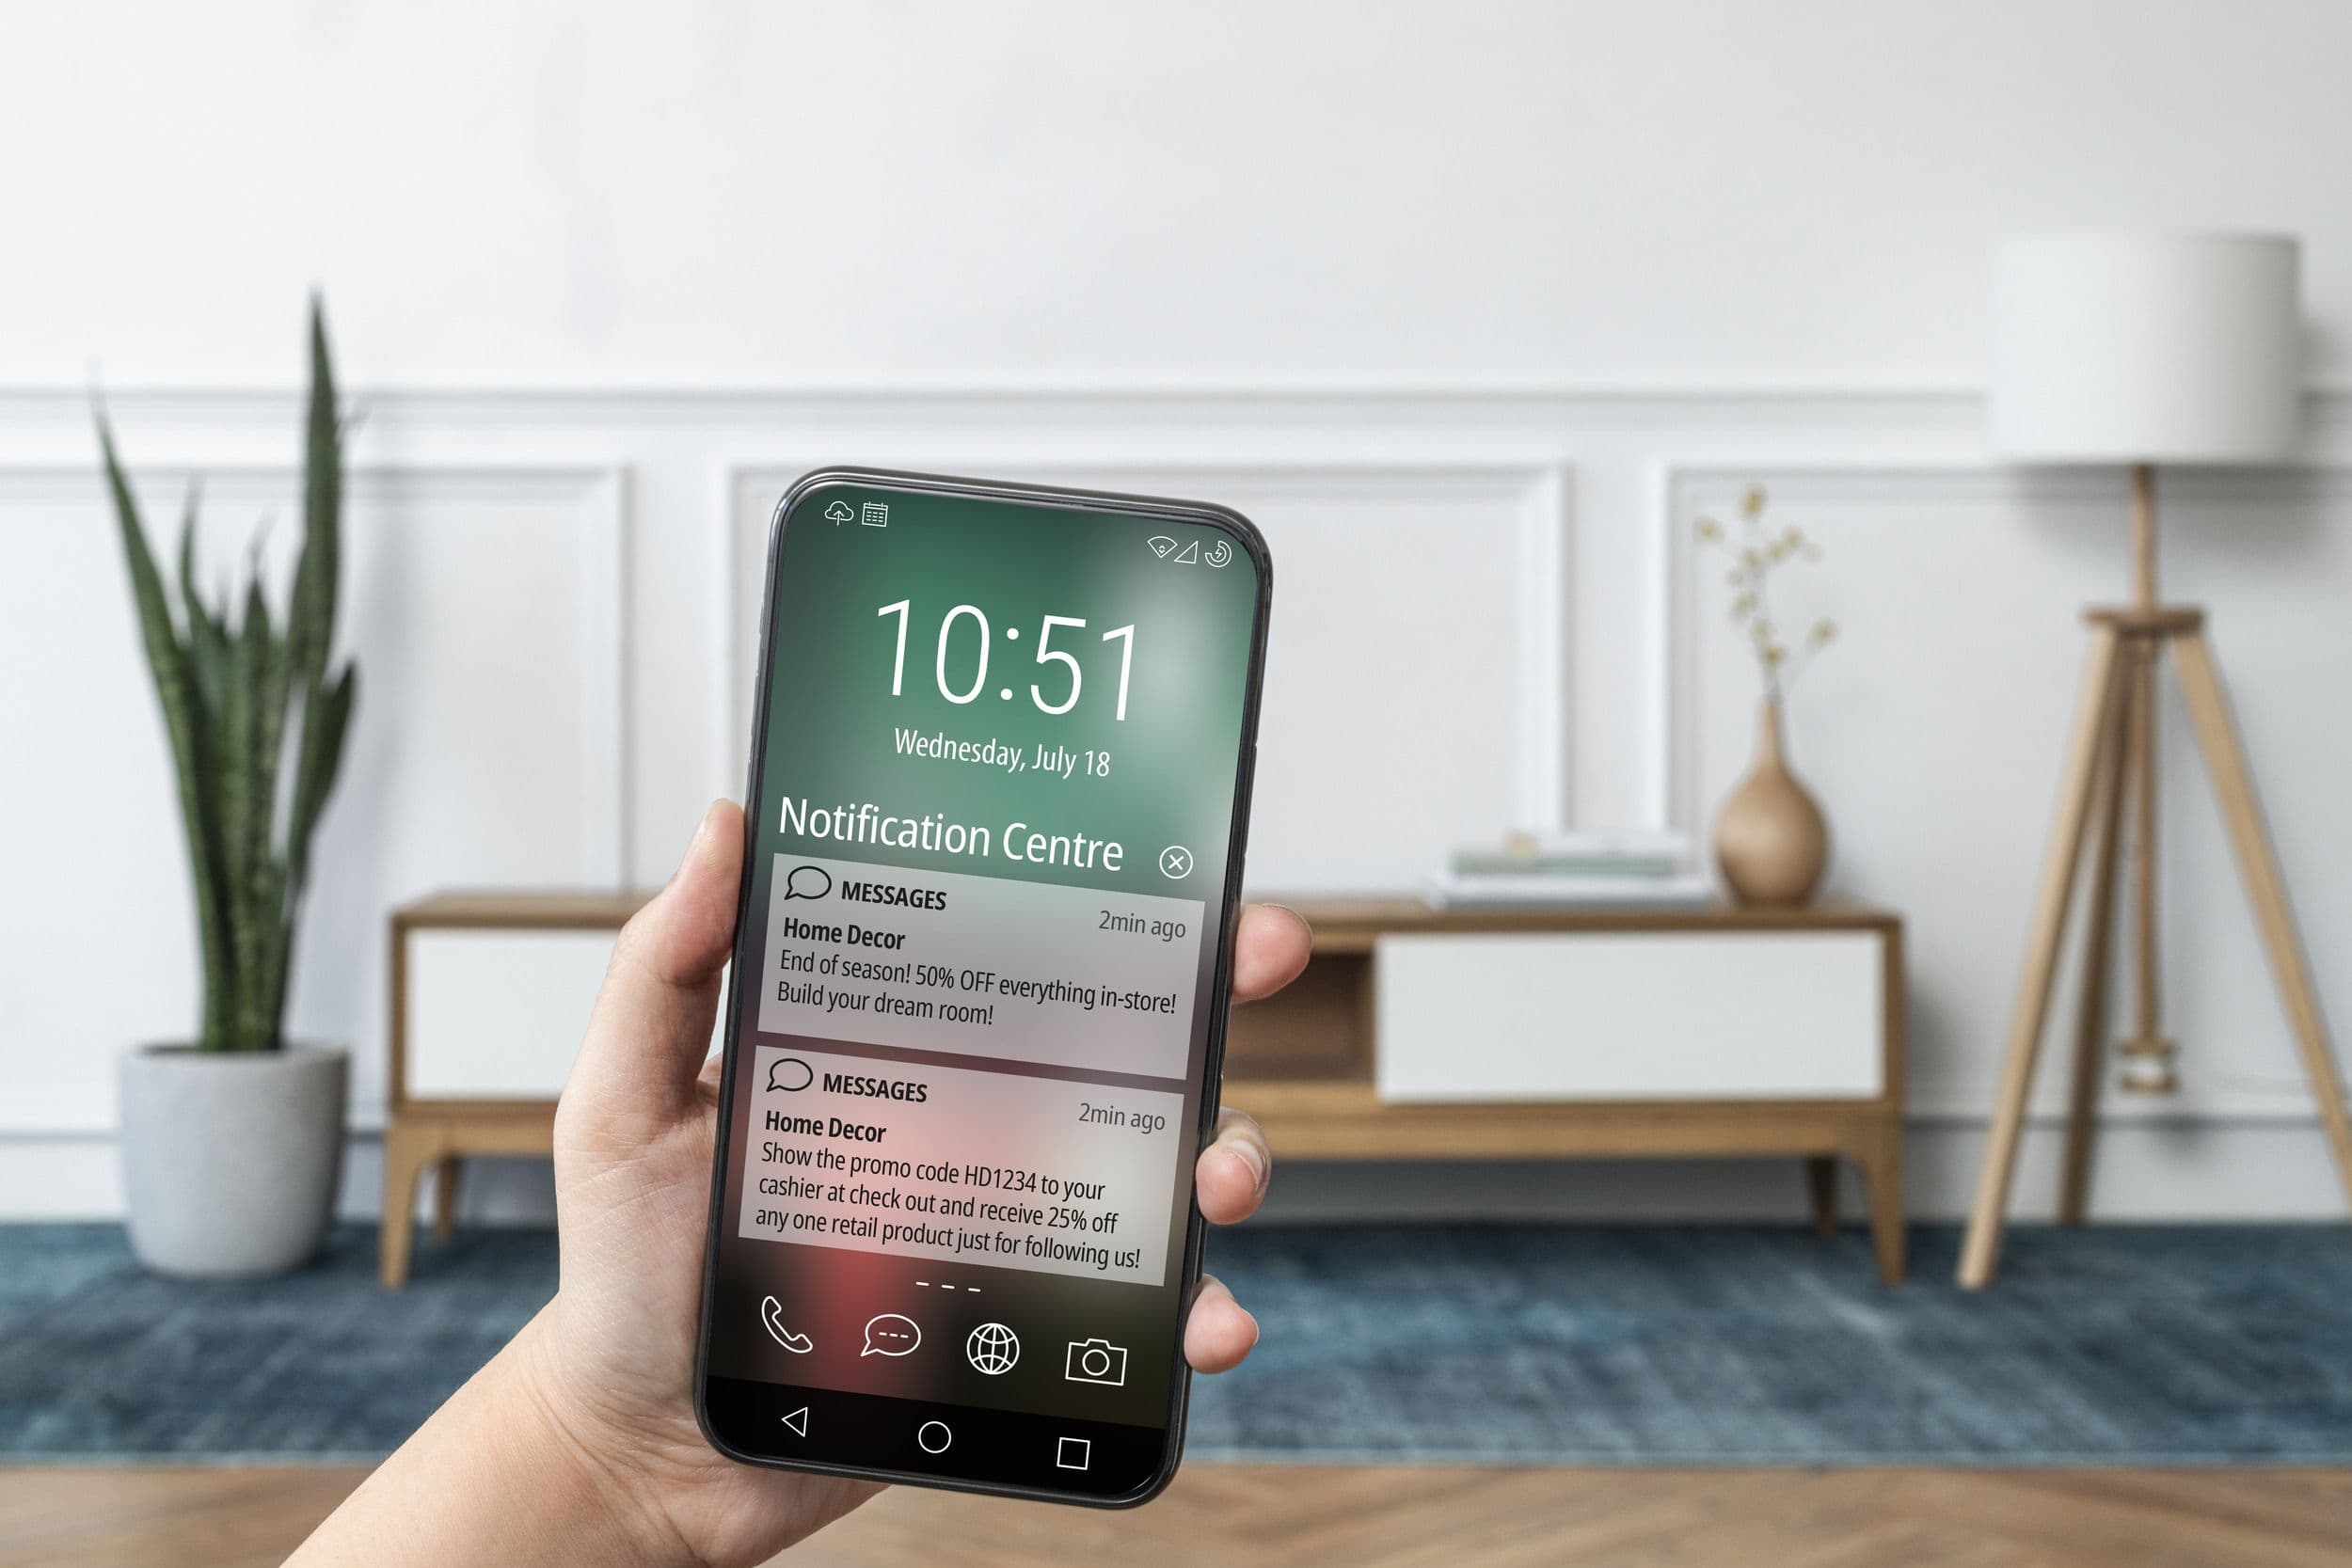
Online- und Offline-Kanäle miteinander zu verbinden ist eine zentrale Herausforderung im Einzelhandel. Customer Journey Mapping liefert dazu Einblicke, wie unterschiedliche Touchpoints kanalübergreifend zusammenspielen. Indem Händler die Customer Journey ganzheitlich verstehen, können sie Integrationsmöglichkeiten erkennen. Dazu gehört, Online- und In-Store-Promotions aufeinander abzustimmen oder eine besondere Technologie wie Ariadne einzusetzen, die über einen Opt-in-Prozess die Kundenpräsenz im Geschäft erfasst und über Unified-Commerce-Plattformen personalisierte Empfehlungen durch das Verkaufspersonal ermöglicht. Mit einem umfassenden Verständnis der Customer Journey können Händler ein konsistentes und stimmiges Erlebnis schaffen, das die Markenidentität stärkt und Kundinnen und Kunden dazu motiviert, über mehrere Kanäle hinweg mit der Marke zu interagieren.
Herausforderung 5: Datenbasierte Entscheidungen treffen
Im Zeitalter von Big Data müssen Händler Erkenntnisse nutzen, um datenbasierte Entscheidungen zu treffen. Customer Journey Mapping versetzt Händler in die Lage, an jedem Touchpoint Daten zu erfassen und auszuwerten und damit fundierte Entscheidungen zu treffen, die die Customer Journey verbessern. Die Auswertung von Daten zu Verhalten, Vorlieben und Schwachstellen hilft Händlern, das Filiallayout zu optimieren, das Sortiment anzupassen und personalisierte Promotions oder Empfehlungen auszuspielen. Mit Technologie und Analyse-Tools gewinnen Händler wertvolle Erkenntnisse und können beurteilen, wie wirksam einzelne Strategien sind. So lassen sich Ansätze schärfen, das Angebot gezielt zuschneiden und letztlich ein individuelleres, zufriedenstellenderes Einkaufserlebnis im Geschäft schaffen.
In-Store vs. digitale Customer Journey: Wo sie sich unterscheiden
Die meisten Vorlagen für Customer Journey Mapping stammen aus dem digitalen Produktumfeld: Anmeldung, Onboarding, Aktivierung, Retention. Der stationäre Einzelhandel hat eine andere Form. Kundinnen und Kunden müssen physisch ankommen, einen Parkplatz finden, durch eine Tür gehen, das gesuchte Produkt finden, sich für einen Kauf entscheiden und das Geschäft wieder verlassen. Jeder dieser Schritte ist ein messbarer Touchpoint, und jeder kann scheitern, und zwar auf Wegen, die in einem digitalen Funnel gar nicht existieren.
Die sechs In-Store-spezifischen Touchpoints, die für die Customer Journey im Einzelhandel zählen:
- Ankunft: Die Kundin oder der Kunde erreicht das Einzugsgebiet. Beeinflusst von Lage, Beschilderung, ÖPNV-Anbindung und konkurrierenden Zielen in der Nähe.
- Parken: Belegung des Parkplatzes, Fußweg vom Stellplatz zum Eingang, ob der Weg überdacht oder ausgeschildert ist.
- Eintritt: Passanten, die tatsächlich durch die Tür kommen. Die Capture Rate liegt hier.
- Navigation: Wie sich Kundinnen und Kunden durch das Geschäft bewegen, welche Zonen sie betreten, wie lange sie verweilen und welche Wege in einer Sackgasse enden.
- Entscheidung: Verweildauer an Möbeln, Auslastung von Umkleiden oder Demobereichen, Wartezeit am Servicedesk.
- Abgang: Kassendurchsatz, Retourendesk und ob die Person mit einer Tüte aus dem Geschäft geht.
Digitale Journey Maps enthalten so gut wie nie die Schritte Ankunft oder Parken, weil es sie online nicht gibt. Im stationären Handel entscheiden sie häufig darüber, ob die Customer Journey überhaupt stattfindet. Ein Geschäft mit starkem Sortiment und schwacher Parksituation verliert die Customer Journey, bevor sie begonnen hat.
Drei Mapping-Vorlagen für In-Store Journeys
Es gibt keine einzig richtige Vorlage für Customer Journey Mapping. Drei Ansätze decken die meisten Situationen im Einzelhandel ab, und welcher passt, hängt davon ab, was Sie herausfinden wollen.
Lineare Vorlage
Touchpoints werden zeitlich von links nach rechts angeordnet: Ankunft, Parken, Eintritt, Navigation, Entscheidung, Abgang. Jeder Schritt erhält eine Zeile für die Handlung der Kundin oder des Kunden, die Handlung des Personals, die unterstützenden Systeme und die Kennzahl, die den Schritt belegt. Geeignet, wenn Sie eine einzelne Einkaufsmission analysieren und sehen wollen, an welcher Stelle sie bricht.
Nach Emotion gruppierte Vorlage
Touchpoints werden nach dem emotionalen Zustand gruppiert, den sie erzeugen: Vorfreude (Ankunft, Parken), Orientierung (Eintritt, erste Zone), Engagement (Navigation, Entscheidung), Abschluss (Kasse, Abgang). Geeignet, wenn die Customer Journey im Großen funktioniert, die Conversion Rate aber schwach ist, weil emotionale Reibung oft zwischen zwei technisch funktionierenden Schritten verborgen liegt.
Vorlage mit parallelen Touchpoints
Zwei oder drei parallele Spuren für Kundinnen und Kunden, die über unterschiedliche Kanäle kommen: Walk-in, Click-and-Collect, Retoure. Jede Spur teilt sich einige Touchpoints (Eintritt, Abgang) und unterscheidet sich an anderen Stellen (Abholtheke vs. Verkaufsfläche). Geeignet für Omnichannel-Geschäfte, in denen eine Filiale mehrere unterschiedliche Customer Journeys gleichzeitig bedient.
Nutzen Sie die Vorlage, die die Frage sichtbar macht, die Sie wirklich beantworten wollen. Eine Vorlage, die ordentlich aussieht, aber auf keine Entscheidung verweist, ist die falsche Vorlage.
Eine In-Store Customer Journey mit Footfall-Daten instrumentieren
Eine Customer Journey Map ohne Daten dahinter ist eine Vermutung. Jeder Block auf der Karte sollte mindestens einer Sensor- oder Counter-Messung entsprechen. Sinn von Besucherdaten zu jedem Schritt der Customer Journey ist, dass jeder Block der Karte überprüfbar wird.
Konkrete Instrumentierung pro Touchpoint:
- Ankunft: Externe Besucherzahlen auf der Straße oder dem Parkplatz, anonym erfasst über einen Overhead-Counter, der auf den Zuweg gerichtet ist.
- Parken: Auslastung des Parkplatzes über einen Schrankenzähler oder ein Sensorraster. Erklärt Werktag-Wochenend-Unterschiede, die der Eintrittszähler allein nicht sichtbar machen kann.
- Eintritt: Türzähler an jedem Eingang. Zusammen mit den externen Besucherzahlen ergibt sich die Capture Rate.
- Navigation: Zonenzähler oder anonyme Erfassung, die festhält, welche Zonen in welcher Reihenfolge betreten werden. Die Auswertung der Heatmap des Geschäfts auf dieser Basis zeigt, wo die Fläche funktioniert und wo sie in einer Sackgasse endet.
- Entscheidung: Verweildauer-Zonen an wichtigen Möbeln, Auslastung der Umkleiden, Verweildauer im Demobereich. Lange Verweildauer ohne Kauf ist ein anderes Signal als kurze Verweildauer ohne Kauf.
- Abgang: Wartezähler an der Kasse, Frequenz am Retourendesk, Tütenquote von einem Türzähler, der nach innen gerichtet ist.
Zwei Auswertungen verändern, wie Teams mit der Karte arbeiten. Erstens Kundenfluss-Muster: die Reihenfolge, in der Zonen betreten werden. Das macht natürliche Wege und unbeabsichtigte Sackgassen sichtbar. Zweitens Conversion-Checkpoints: das Verhältnis von Eintritten in eine Zone zu Käufen aus dieser Kategorie. Das trennt ein Findungsproblem von einem Entscheidungsproblem.
Praxisbeispiel: ein Elektronik-Markt im Stil von MediaMarkt
MediaMarkt betreibt großflächige Elektronik-Märkte, oft am Stadtrand oder als Ankermieter in einem Einkaufszentrum, mit klar getrennten Zonen: Weiße Ware, Braune Ware, Mobilfunk, Gaming, Zubehör und Servicedesk. Die Customer Journey eignet sich als Walkthrough, weil Kundinnen und Kunden mit unterschiedlichen Missionen kommen (recherchieren vs. ersetzen vs. schenken) und das Geschäft alle durch die gleiche Tür bedienen muss.
Lineare Vorlage angewandt auf einen typischen Samstagnachmittag:
- Ankunft: Die Kundin oder der Kunde fährt aus dem Einzugsgebiet an. Externe Besucherzahlen im Eingangsbereich erfassen den Zulauf; der Schrankenzähler des Parkplatzes registriert das Fahrzeug.
- Parken: Belegungsdaten zeigen, ob der Platz angenehm leer oder voll ist. Ein voller Parkplatz ist ein bekannter Treiber für abgebrochene Besuche, noch bevor der Türzähler überhaupt einen Eintritt verbucht.
- Eintritt: Der Türzähler registriert einen Eintritt. Zusammen mit der externen Zahl erkennt das Team, ob ein schwächerer Tag ein Besucherzahlen-Problem oder ein Capture-Rate-Problem war.
- Navigation: Zonenzähler zeigen, dass die Person zuerst zur TV-Wand geht, dann zum benachbarten Soundbar-Regal und anschließend zum Zubehör. Wer direkt zu Mobilfunk geht, hat eine andere Mission. Das Visual-Merchandising-Team kann beide Muster vergleichen.
- Entscheidung: Verweildauer-Zähler vor der TV-Wand zeigen, wie lange Kundinnen und Kunden an den Geräten stehen. Lange Verweildauer ohne Bewegung Richtung Kasse ist das klassische Signal, dass die Personalquote zu niedrig ist.
- Abgang: Kassendurchsatz und Tütenquote am Ausgang schließen die Schleife. Eine hohe Tütenquote bei hoher Verweildauer bedeutet, dass die Filiale konvertiert. Eine niedrige Tütenquote bei hoher Verweildauer deutet auf Personal, Preis oder Verfügbarkeit.
Es geht nicht darum, dass MediaMarkt es genau so macht. Es geht darum, dass die lineare Vorlage zusammen mit Besucherdaten je Zone aus einer vagen Vermutung („Samstagnachmittage fühlen sich langsam an") eine überprüfbare Aussage macht („Eintritte stabil, Verweildauer an der TV-Wand stabil, aber das Verhältnis von Eintritten zu Käufen in dieser Kategorie ist gegenüber den vier vorherigen Samstagen um 18 % gesunken"). Die eingesetzte Plattform für Retail-Analytics muss diese Auflösung liefern, nicht nur einen Türzähler-Wert.
Zwei Folgeschritte zahlen sich nach der ersten Instrumentierung meist aus. Erstens eine Nachfass-Ansprache nach dem Besuch, abgestimmt auf die Zonen, die tatsächlich besucht wurden. Zweitens ein ehrlicher Blick auf die Auslastung von Umkleiden oder Demobereichen für Kategorien, die handfeste Produktnähe brauchen. Beides verwandelt Erkenntnisse aus der Customer Journey Map in etwas, an dem das Filialteam in der nächsten Woche arbeiten kann.
Fazit
Stationäre Händler sehen sich im heutigen Einzelhandelsumfeld zahlreichen Herausforderungen gegenüber. Customer Journey Mapping im Geschäft bietet jedoch eine starke Antwort. Indem die Customer Journey kartiert und jeder Touchpoint analysiert wird, gewinnen Händler wertvolle Erkenntnisse, mit denen sie diesen Herausforderungen direkt begegnen können. Ob es um die Konkurrenz durch den E-Commerce geht, um die Anpassung an wandelndes Konsumverhalten, die Optimierung der Betriebskosten, eine gelungene Omnichannel-Integration oder datenbasierte Entscheidungen: Customer Journey Mapping liefert Händlern die Werkzeuge, um das Einkaufserlebnis im Geschäft zu verbessern und in einem sich stetig wandelnden Markt zu bestehen.
Wenn Sie mehr darüber erfahren möchten, wie die Technologie von Ariadne Ihrem stationären Geschäft hilft, diese Herausforderungen zu meistern, melden Sie sich gerne. Wir geben Ihnen weitere Informationen und beantworten Ihre Fragen.