Why should we love shopper flow insights?
Retail store layout, or store design, is the layout that retailers use to organize their products, fixtures, and merchandise in brick-and-mortar stores. Traditionally, a primary goal of store layout is to improve shopper flow and maximize sales, using best performing category adjacencieses. The layout designer must consider that people do not navigate the same way in each store. Products (apparel, groceries, furniture, hardware, etc.), demographics, store location,available space, and target customers, all need to be considered when creating specific store layouts.
he post-COVID rebirth of the brick-and-mortar retail requires a customer-centric layout that directly corresponds to the new way that shoppers navigate those stores. Store layout design should not just include enhancing shopper navigation. Insights about the shopper flow patterns allow retailers to optimise the design of new layouts that will attract more customers, encourage the impulsive pick up of products and create a memorable shopping experience. Creating the right shopping experience is critical as physical retail still represents most sales and customers expect an experience that can’t be provided online.
Let's see how a well-known retailer used shopper flow analytics and small changes in the store layout to drive a 5X increase in shopper visits to specific areas and increase sales.
What is happening in reality?
Poor traffic flow is a common issue in retail stores, negatively impacting the customer experience and discouraging shoppers from spending more time exploring the store and purchasing more. Poor category positioning, narrow or twisted aisles, and blocked shoppers’ views are some of the typical mistakesin store layout. Additionally, categories are often placed close to each other based on experience, intuition, and gut feel rather than real data, further confusing shoppers attempting to complete their shopping mission and even upsetting shoppers with overcrowded aisles, departments, and fixtures.
If not addressed, stores will face disorganized traffic flows, cramped product areas, and a horrible customer experience leading to less shopper exploring and decreased sales and loyalty. Ariadne's Shopper Journeyfeature gives retailers the ability to track shoppers and their journeys, including major and minor shopper flows, optimize in-store traffic patterns, and continued enhancement of store layout. The resulting optimized store design enhances the customer experience, increases cross-selling and up-selling, and boosts loyalty and sales.
What can the retailer do?
A large retailer is using Ariadne's platform to track thein-store shopping journey and optimize the layout of each store. To achieve that, the retailer started with insights from two stores.The comparison of shopper journeys, including dominant shopper flows, revealed good and bad practices significantly influencing the shopper journey.
1. Positioning matters
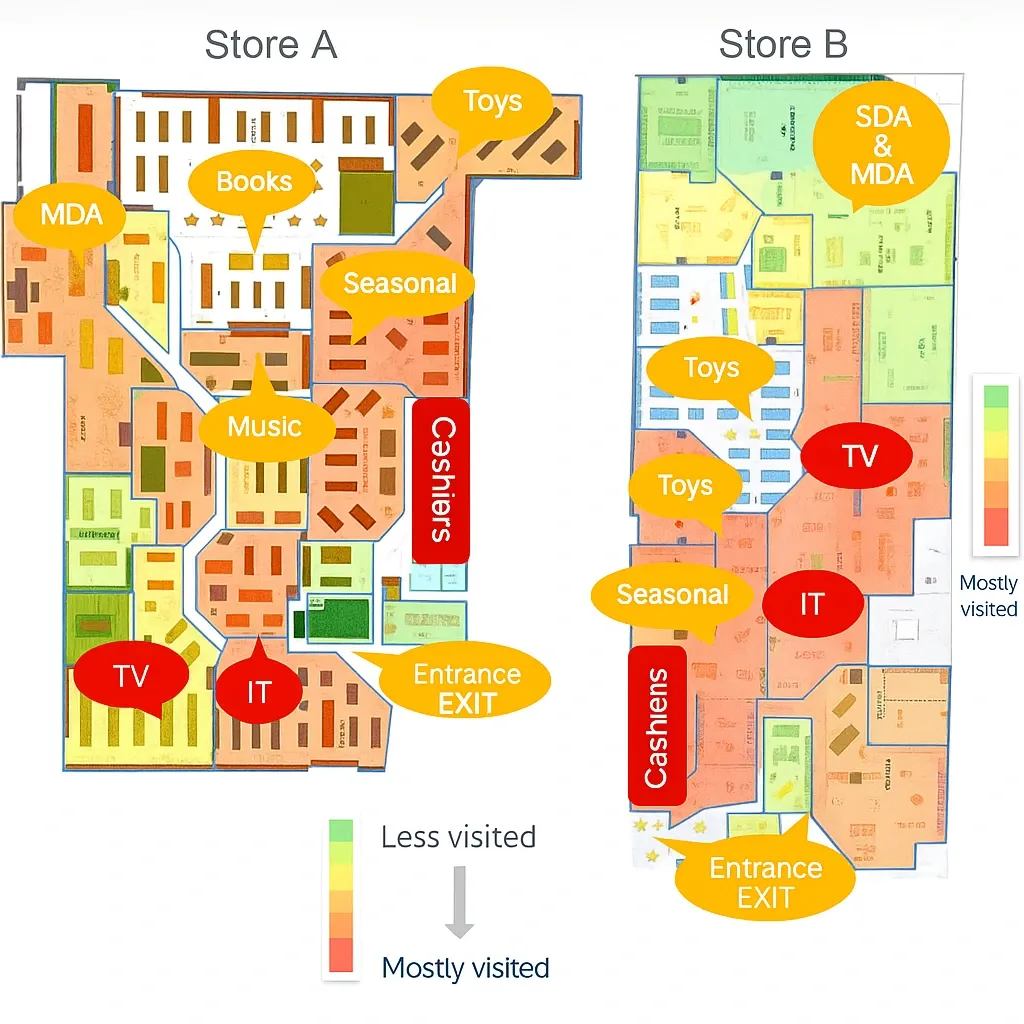
As many studies have found, less visited product areas benefit when they are placed on the right side of more visited or popular areas as customers tend to move to the right. In the illustrations below, two different stores positioned a less visited product category - TV sets in this case - in different locations. By using the Ariadne platform, the retailer was able to see the data proving that when the TV department is placed to the right of the IT department products (Store B), the TV department is visited by far more shoppers compared to visitors resulting from the placement in Store A. This small difference in the TV department location is resulting in 5X increase in TV department traffic and a significant increase in sales.
2. Make it last longer
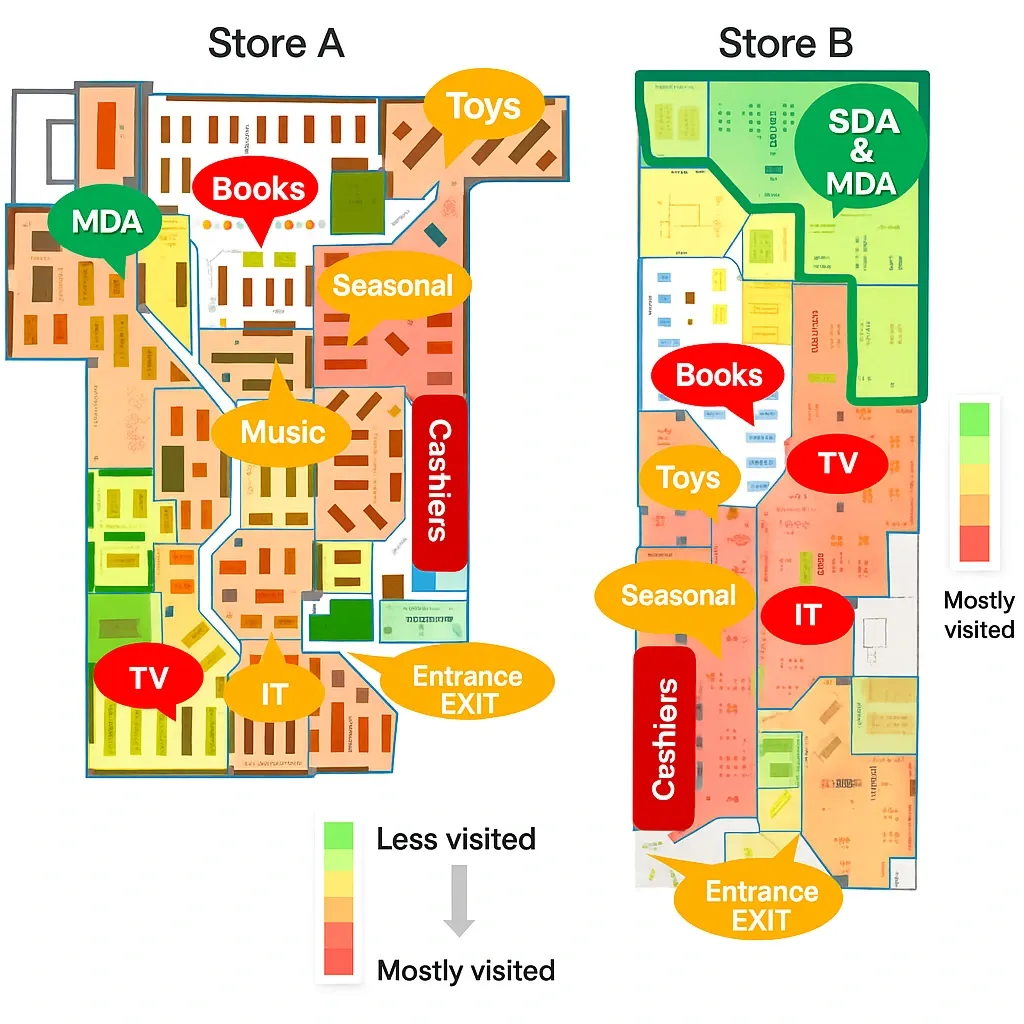
Using Ariadne, this retailer discovered that popular product areas placed at the centre of the store or near the cashiers was interrupting shopper journeys early, resulting in lost sales. Books are one of the top categories for this retailer, so their location in the store has a significant impact to shopper flow. As shown in the illustration below, Store B placed books near the centre of the store. As a result, almost half of the store is rarely visited because customers have already accomplished their intended shopping goal. The placement of books in Store B disrupts the shopper journey, forcing it to end prematurely. However as seen below, Store A placed Books in the back, resulting in a far better customer journey distribution among all departments and across the entire store, impacting both customer experience and sales.
3. Popular and non-popular: The perfect match
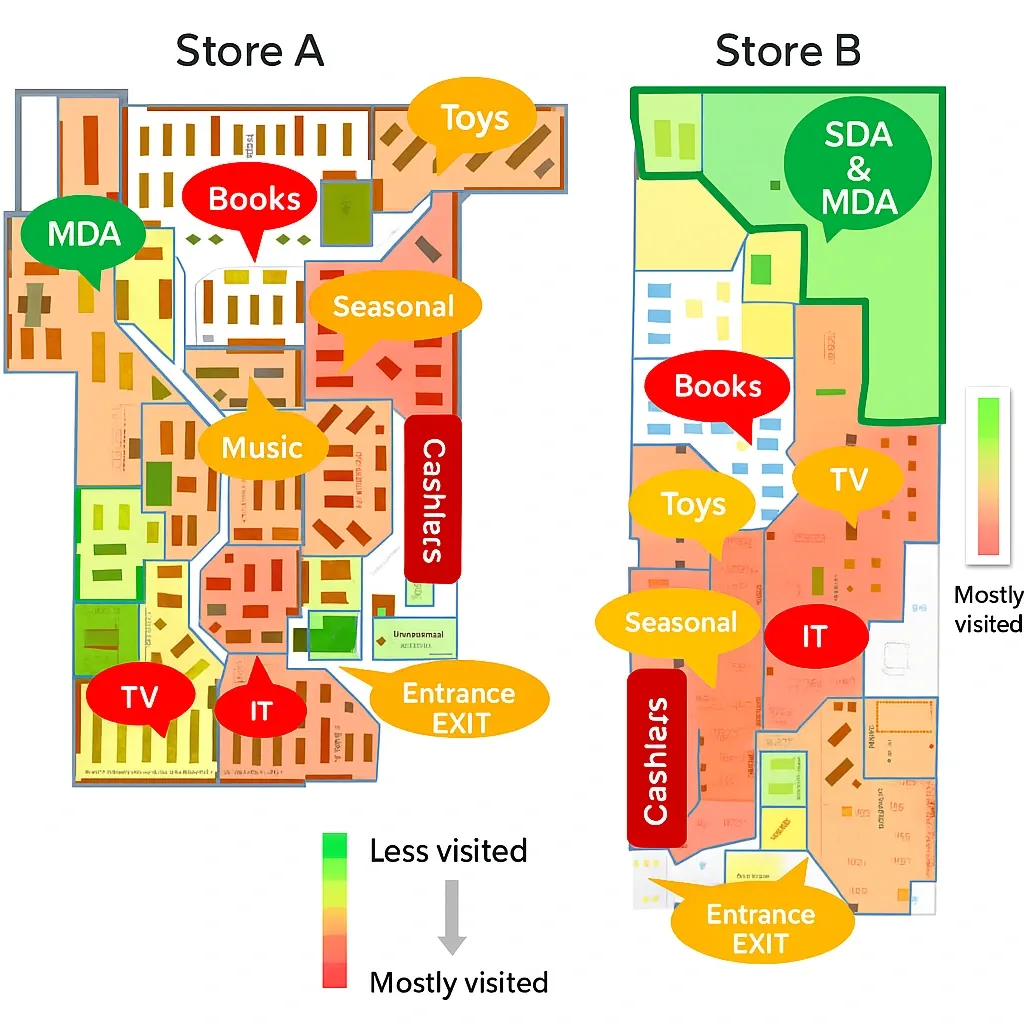
This retailer also learned that placing the most visited product categories side by side disrupted shopper navigation, negatively impacting all product categories. Using actual data, they were able to learn, and see, that putting popular categories next to each other resulting in many shoppers gathering in the same areas and discouraging other shoppers from visiting or passing through those areas. Shoppers were discouraged and decreased additional store exploration, decreasing sales. This effect is even more pronounced post-COVID as shoppers avoid crowded and cramped spaces. A real example of this effect is seen in the illustration below. In Store B the IT department is near Books. As both Books and IT are popular departments they draw the most shoppers, creating the crowd effect and discouraging other shoppers from additional exploration and visiting areas beyond those two departments. With this discovery, this retailer was addressed combining popular with less popular product areas. In Store A, the Major Domestic Appliances (MDA), a less visited department, was placed next to Books, a popular category. The retailer was able to measure the result with Ariadne’s platform, with the data showing that shopper flow was spread out, supporting better shopper journeys, more shoppers visiting more departments, increased exploration of less visited areas, and increased to sales.
4. Ultimate match, a strategic match
Good store design and layout also enables shoppers to find various products in a more convenient way. By positioning more often visited and less often visited categories that are complementary, the perfect match above is transformed into a strategic match. This design strategy encourages increased store exploration, creates product discovery, and results in increased impulse purchases as well as the cross-selling and up-selling benefits outlined previously. In Store A, shown below, the Toy department was placed in what could be seen as a challenging location. However, because of its positioning adjacent to Children's Books, shoppers visited Toys even more often and the cross-selling impact from Books was 94%.
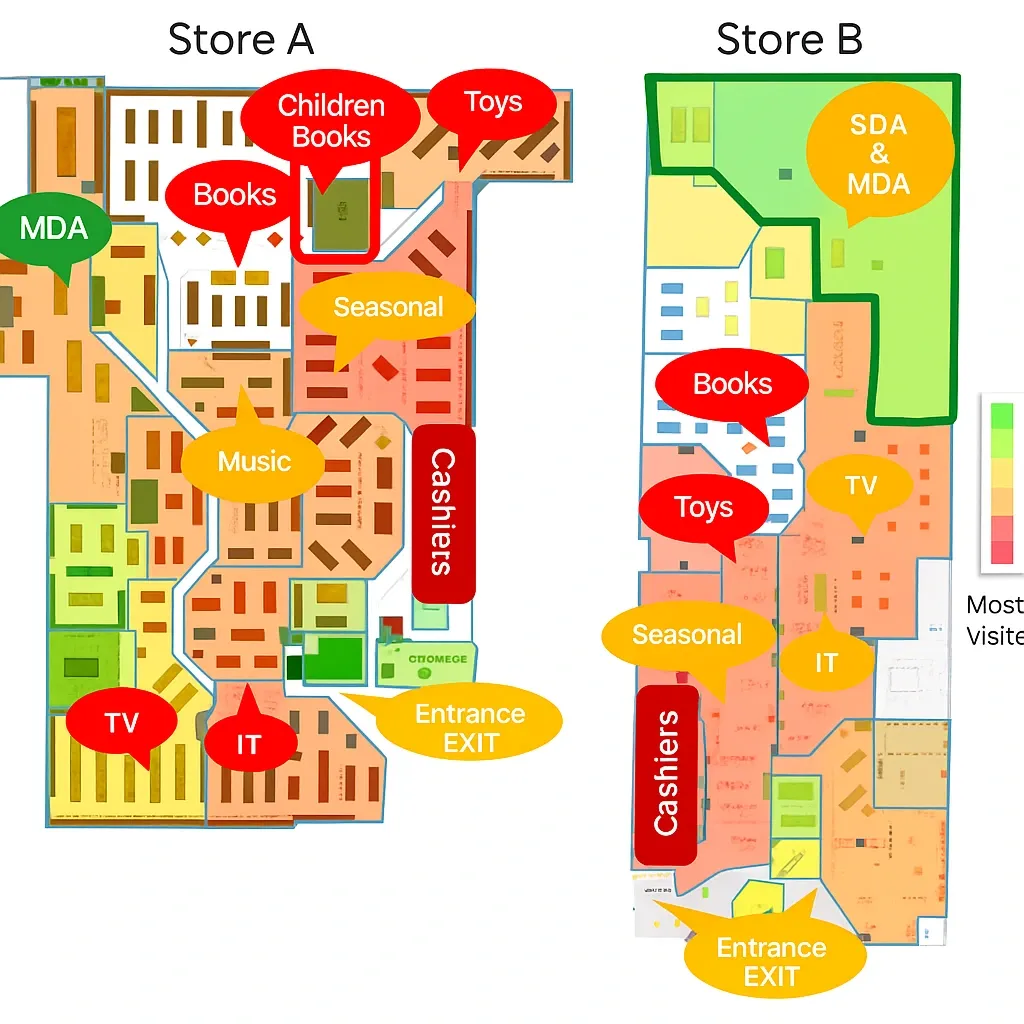
With this strategic match approach, Store A was able to free up valuable space within the shopper's journey by moving Toys and moving MDA adjacent to Books. Although MDA and Books would not seem to be complementary, that move resulted in a 2X increase in visitors to the MDA area and a significant increase to sales as well.
What is shopper flow?
Shopper flow is the sequence of zones a customer enters from the moment they step through the door to the moment they leave. It is not the same as foot traffic. Foot traffic is a count; shopper flow is the path. A store can have strong foot traffic and broken flow at the same time, and the difference shows up in conversion rate, dwell time, and where staff time is wasted. Four flow patterns cover almost every physical store in 2026: loop, racetrack, free-flow, and grid.
The 4 flow patterns, with named examples
Every retail layout is some variation of one of four patterns. The pattern dictates what conversion looks like, where dead zones form, and where staff coverage matters most. The named examples below are illustrative. Public-company examples (IKEA, Costco) describe publicly observable layout choices and are not implied to be Ariadne customers. Allowlist examples (Breuninger, Deichmann) are referenced for layout pattern only.
Loop (forced racetrack), the IKEA pattern
A loop layout forces shoppers along a single predetermined path that visits every department before reaching checkout. IKEA is the canonical public example: arrows, room sets, a marked path through showroom and market hall, and the famous shortcut doors for shoppers who already know what they need. Loop layouts capture high dwell because the shopper sees every category. The conversion-rate effect is positive for impulse purchases and category discovery, weaker for mission shoppers who came for one thing. Dead-zone risk is low by construction. Common mistakes: the loop is too long for the visit time most shoppers actually have, the shortcut is too well hidden, or the staff coverage at the end of the path collapses because everyone is in the front room sets.
Racetrack (open racetrack), the department-store pattern
A racetrack layout puts a clear circulation aisle around the perimeter with department islands inside. The shopper is guided around the floor but can step off the racetrack into any department at will. Breuninger and other premium department stores use this pattern: defined main aisles, visible department thresholds, and merchandising that lives both on the racetrack edge and in the interior islands. The conversion-rate effect is strong for cross-category visits because the shopper passes the door of every department. Dwell time is moderate. Dead-zone risk concentrates in interior corners, away from the perimeter aisle. Common mistakes: the racetrack is interrupted by columns or back-of-house doors, interior islands are too tall and break sight lines, or the threshold between racetrack and department is unclear and shoppers walk past without entering.
Free-flow (open-plan), the fashion-boutique pattern
Free-flow layouts have no prescribed path. Fixtures, tables, and display walls are placed to invite browsing rather than to guide circulation. Deichmann and many other footwear and fashion specialists use a free-flow pattern in their high-street formats: low fixtures at the front, taller walls of stock toward the back, and a fitting-room block tucked to one side. The conversion-rate effect depends almost entirely on the discoverability of the fitting room and the staff-coverage ratio. Dwell time is the highest of the four patterns. Dead-zone risk is also the highest because nothing forces the shopper into the back third of the floor. Common mistakes: the back wall is the only thing that pulls shoppers past the front zone and it carries the wrong category, the fitting room is hidden, or sightlines from the door do not reach into the depth of the store.
Grid (aisle), the supermarket and electronics pattern
Grid layouts use parallel aisles between tall fixtures, with end-cap displays at each aisle head. Supermarkets are the canonical example; Costco is a public illustration with extra-wide aisles, pallet displays, and a deliberate routing past the bakery, electronics, and seasonal aisle on the way to the staples at the back. Grid is built for mission shopping at speed and for very high item density per square metre. The conversion-rate effect is strong for high-frequency items the shopper came for. Dwell time is low; that is the point. Dead-zone risk is concentrated in the middle of long aisles, between the end caps. Common mistakes: end caps are merchandised but the aisle middle is not, the routing past discretionary categories is too aggressive and damages the trust shoppers place in the store, or aisles are too narrow and the shopper bounces.
How shopper flow connects to conversion rate
Conversion rate is the number of transactions divided by the number of entries. Shopper flow is upstream of conversion in three ways. First, capture: the flow pattern decides how many of the entries reach the high-conversion zones at all. A loop captures close to 100% because the path is forced; a free-flow can capture less than 40% to the back third of the store. Second, dwell: each pattern produces a distinctive dwell profile, and dwell at the right fixtures is the strongest correlate of category conversion. Third, recovery: when a category misses its conversion target, the diagnosis depends on whether the flow brought entries into the zone at all (a capture problem) or brought entries but did not produce dwell (a merchandising or staffing problem). Without flow data the team is guessing which lever to pull.
How to instrument shopper flow without cameras
Camera-based heatmaps are not the only option, and in many EU retail environments they are not the preferred option for privacy reasons. A modern instrumentation stack that avoids identifying individuals looks like this:
- Footfall counters at decision points: every entrance, every aisle head, every threshold between departments. No PII captured at the sensor, so the only data leaving the device is integers per minute per zone.
- Zone occupancy and dwell measurement: an anonymous overhead sensor per zone that emits zone-enter and zone-exit events, never a re-identifiable trail of one specific person.
- Queue measurement at the checkout and at decision points where staff intervention matters: fitting-room desk, click-and-collect counter, returns desk.
- A floor-plan overlay that ties counts and dwell back to a named zone. Without the floor plan the data is numbers without context.
Together these read out as a flow map that respects DSGVO by construction. For the underlying counting layer see Ariadne's people-counting solution; for the layered view across counts and dwell, the retail analytics platform sits one layer above. The accompanying store heatmap interpretation guide covers how to read a heatmap without over-interpreting noise.
A worked walkthrough: a free-flow fashion store in a mid-mall position
Consider a single-storey fashion specialist in a mid-mall position with a free-flow layout, roughly 600 square metres of selling floor and one fitting-room block tucked to the left of the back wall. The store records around 18,000 entries per month. The team's hypothesis is that conversion is soft for outerwear, which sits along the back wall.
The instrumentation reads out three findings. First, the door counter shows entries are holding steady against last year. Second, the zone counter on the back third of the floor shows capture to back zones at 38%, which means three out of five shoppers never see the outerwear wall. Third, the fitting-room counter shows utilisation lower than expected for the entry volume, with the bottleneck clearly at the desk handing out fitting-room tokens. The diagnosis is not an outerwear merchandising problem; it is a flow problem that prevents most entries from reaching outerwear, plus a fitting-room intake bottleneck that suppresses conversion among the shoppers who do reach it.
The interventions follow from the diagnosis. A pull element (a strong visual or a known-traffic category) is moved into the back third of the floor to lift capture from 38% toward 60%. The fitting-room desk is restaffed to remove the intake bottleneck. Both changes are then re-measured against the same flow map. The point of the in-store customer journey view is that each move is testable against the data, not against intuition.
Common shopper flow mistakes
Four mistakes account for most of the flow-related conversion loss across the four patterns:
- Dead zones in the back third or in interior corners. The fix is a pull element strong enough to break the line of sight from the door and reset the shopper's path.
- Queue overflow at decision points. Fitting-room desks, returns counters, and click-and-collect points block the natural flow when they queue. The fix is staffing, not signage.
- Fitting-room bottleneck. In fashion the fitting room is the conversion gate; if it queues, the rest of the layout does not matter. The Gruen Effect and forced flow lift entries past the fitting room, but only working intake converts them.
- Exit-side merchandising that competes with the checkout. The shopper has decided to buy; presenting a new category between decision and till loses both the impulse buy and the original transaction. Use the decompression zone effect for arrival, not for exit.
Shopper flow FAQ
What is the difference between shopper flow and foot traffic?
Foot traffic is a count. Shopper flow is the path. A store with 10,000 entries per week can have any of four very different flow shapes, and the conversion rate is decided by the flow, not the count.
Which shopper flow pattern is best?
There is no universal best pattern. Loop suits high-discovery destinations like furniture or homewares. Racetrack suits multi-category department stores. Free-flow suits fashion and beauty where browsing is the point. Grid suits supermarkets and electronics where mission shopping dominates. The wrong pattern for the category produces the worst conversion rate of all.
How long does a shopper flow study take?
A baseline read needs at least four full trading weeks to absorb day-of-week and weather variance. A reliable intervention test needs at least four weeks before and after the change, because a single week can be noise. Faster reads are possible only when the effect size is very large.
Can shopper flow be measured without cameras?
Yes. No-PII footfall counters at decision points, zone occupancy sensors, and queue counters cover the same ground as camera-based heatmaps without producing identifiable footage. The data is integers per zone per minute, not images.
Conclusion
This real and simple case study proves that retail store layout design is not just about improving navigation. It now requires a deep understanding of shopper flow, including critical insights about customer journeys in specific stores including shopper paths, flow patterns, number of customers, areas visited, time in each area, and more. With this data and insights retailers can design and continuously improve store layouts that support shopper exploration, an exceptional customer experience, increased conversion at store and department level, and significantly increased store performance. Retail winners post-COVID-19 will understand their shopper's journeys through data and insights, allowing them to optimize the customer experience and reap the rewards of increased loyalty and sales.
Want to learn more about how Ariadne supports retailers in tracking shopper flow patterns? Go ahead and book an appointment: Let's Talk!