On this page
- What is an anchor tenant?
- History: department-store anchors and the 20th-century mall blueprint
- Types of anchor tenant
- Anchor tenant examples and the sectors that dominate
- Anchor tenant economics: rent, co-tenancy, percentage rent, KOR
- How much footfall does an anchor tenant actually drive?
- The 2020-2025 decline of department-store anchors
- Modern replacements: F&B, fitness, healthcare, coworking, entertainment
- Measuring anchor performance with footfall data
- What this means for shopping-centre operators in 2026
What is an anchor tenant?
An anchor tenant is a large retailer that attracts visitors to a shopping centre and is contractually positioned to drive footfall to smaller tenants. Anchor leases run 10 to 25 years, often at below-market rent, in exchange for the traffic the anchor delivers.
The term "anchor" borrows from sailing: an anchor keeps a ship from drifting because of its size and weight. An anchor tenant performs the same role for a shopping centre. It is the gravitational mass that holds the rest of the tenant mix in place. Without an anchor, a mall's smaller stores have to draw shoppers on their own, and most cannot.
Anchors are usually grocery (Aldi, Lidl, Edeka, Rewe, Carrefour), DIY (Hornbach, Bauhaus, OBI, Leroy Merlin), department store (Galeria, El Corte Inglés, John Lewis), large fashion (Primark, H&M flagship, Zara flagship), or category-killer electronics (MediaMarkt, Saturn, Fnac). What matters is not the sector but the asymmetry: the anchor pulls visitors who would not otherwise enter the building.
For landlords, the anchor is the single largest lever in centre performance. For smaller tenants, it is the reason their store works at all. For investors, the strength of the anchor is the first line in a centre's valuation memo.
History: department-store anchors and the 20th-century mall blueprint
The modern anchor model started in North America in the 1950s. Victor Gruen, the Austrian-American architect who designed Southdale Center in Edina, Minnesota in 1956, embedded two department stores at opposite ends of the building and ran the smaller tenants down a climate-controlled mid-corridor between them. Shoppers walked from one anchor to the other and passed every inline store on the way. The geometry was the marketing.
European shopping centres adopted the same blueprint through the 1960s and 1970s, often with a hypermarket replacing the American department store on one end. Carrefour in France, Asda in the UK and Real and Kaufland in Germany became the new anchors. The dwell-time logic was identical: the grocery run brought weekly traffic, and the inline stores converted that traffic into impulse purchases.
Through the 1980s and 1990s, department stores remained the dominant anchor format in mid-market and luxury centres. JCPenney, Sears, Macy's, Karstadt, Kaufhof, Debenhams and BHS each operated hundreds of branded boxes. Anchors received below-market rent (sometimes under EUR 5 per square metre per month, against EUR 80 to 200 for inline fashion units) precisely because their traffic gift was so large.
That blueprint held for fifty years. It started cracking in the 2000s, broke in the 2010s, and collapsed in the early 2020s. The economics that powered the anchor model, cheap rent in exchange for guaranteed traffic, only work when the anchor actually delivers traffic. Once department-store sales per square metre fell below the level needed to justify their own footprint, the deal stopped working for everyone.
Types of anchor tenant
Practitioners distinguish at least eight anchor formats. They differ in lease length, rent per square metre, and the kind of footfall they generate.
Traditional anchor
The classic department store or hypermarket, 8,000 to 25,000 square metres, occupying an end-cap position with its own external entrance. Lease lengths run 15 to 25 years. Examples: Galeria Kaufhof in Germany, El Corte Inglés in Spain, John Lewis in the UK, Macy's in the United States. This is the format that is in the deepest structural decline.
Junior anchor
Half the footprint of a traditional anchor, typically 3,000 to 8,000 square metres. Category specialists like H&M, Primark, MediaMarkt, Decathlon, TK Maxx and Uniqlo. Lease lengths 10 to 15 years. This format has held up the best because the brands inside are still individually relevant.
Mini anchor
1,500 to 3,000 square metres. Smaller fashion flagships, mid-tier electronics, mid-tier sport. Often used by centres that cannot land a full junior anchor or want to break up a long corridor with multiple smaller pulls instead of one big one.
Shadow anchor
A large retailer that sits outside the leased boundary of the shopping centre but is close enough to drive traffic to it. A standalone IKEA next to a regional mall is the canonical example. The centre benefits from the footfall without paying for the lease.
Restaurant and F&B anchor
Food halls, signature restaurants, and large brewpubs that pull dwell time rather than transaction count. The Time Out Market format (Lisbon, London, Porto, New York, Dubai) is the European reference case. F&B anchors now command per-square-metre rents closer to fashion than to traditional anchors because their dwell-time multiplier is so high.
Office anchor
Large office tenants in mixed-use schemes whose employees provide weekday lunch and after-work footfall. Typical of central-business-district developments and the Stadtquartier mixed-use format common in German city centres.
Mixed-use anchor
Residential, hotel or medical components integrated into the shopping centre footprint. The anchor in these schemes is not a retailer at all but the building programme. Residents and hotel guests generate captive footfall for the retail floor below.
Experiential anchor
Cinemas, trampoline parks, indoor skydiving, climbing gyms, bowling, indoor theme parks. These pull longer-dwell-time visits and are over-indexed against weekend and evening hours when traditional anchors underperform. Cinema chains were the first experiential anchors; the post-2020 expansion is in family-entertainment formats.
Anchor tenant examples and the sectors that dominate
Naming an anchor is easier than measuring one. To identify which sectors actually anchor European centres in practice, we looked at a sample of shopping centres and asked, for each one, which tenant pulls the most traffic. The breakdown of anchor tenants by sector is below.
On average, 23% of the stores in a shopping area function as anchors. That category includes grocery stores, DIY, and small high-utility units (post offices, ATMs, kiosks, tobacconists) that act as mini-anchors in suburban schemes. Of the named anchors in the sample, 60% are grocery stores. Grocery is the dominant European anchor format because the visit frequency is weekly rather than seasonal, and the dwell time is short enough that the centre's inline tenants get multiple bites at the same visitor over the year.
Grocery anchors also occupy the largest individual footprint of any tenant in their centre. A typical Edeka Center or Carrefour runs 4,000 to 8,000 square metres, dwarfing the 80 to 200 square metres of an inline fashion unit. That footprint asymmetry is the lever that justifies the rent asymmetry: a single grocery anchor at EUR 8 per square metre per month delivers more footfall to its neighbours than thirty inline fashion units at EUR 80 per square metre per month.
Anchor tenant economics: rent, co-tenancy, percentage rent, KOR
Anchor leases differ from inline-tenant leases on every material term. The five terms that decide whether a deal is good for the landlord are below.
Base rent per square metre
Anchor rent runs 60% to 90% below inline rent. A grocery anchor that pays EUR 6 to 12 per square metre per month sits in the same centre as inline fashion units paying EUR 60 to 200. Department-store anchors historically paid even less. The asymmetry is intentional: the landlord is buying traffic, not rent.
Percentage rent and turnover rent
Many anchor leases include a turnover-rent clause. The anchor pays base rent plus a percentage of revenue above a defined threshold. Standard rates run 3% to 7% of revenue above the breakpoint. In Germany this is called Umsatzmiete. The clause aligns landlord and anchor incentives but requires audited revenue reporting, which most landlords now demand monthly.
Co-tenancy clauses
Anchor leases routinely contain co-tenancy clauses that allow the anchor to reduce rent (or exit the lease entirely) if other named anchors leave the centre. A typical clause: "if either of [Anchor B] or [Anchor C] ceases to operate for more than 90 consecutive days, Tenant may reduce base rent by 50% until a replacement of equivalent draw is in occupation." Co-tenancy clauses are the single most painful surprise for new landlords because the failure of one anchor triggers cascading rent abatement across the rest of the rent roll.
Kickout rights (KOR)
A kickout right allows the anchor to exit the lease if its own sales fall below a defined floor for a measurement period, typically 12 months. Standard thresholds run EUR 2,000 to 4,000 per square metre per year. Below that floor, the anchor can walk. KOR is the anchor's protection against the failure of the centre. For the landlord it is a one-way risk: the anchor exits when the centre is already in trouble.
Occupancy cost ratio
Occupancy cost ratio is the anchor's total real-estate cost (base rent, service charges, marketing levies, percentage rent) divided by the anchor's sales. Anchors target an OCR of 4% to 8% of sales. Above 10%, the anchor is considering an exit. Above 12%, it is preparing one. Landlords who monitor anchor OCR have advance warning of the exit conversation; landlords who do not get blindsided. For the deeper mechanics of how these terms interact across an anchor's full lease lifecycle, see our forthcoming guide to anchor tenant lease economics.
How much footfall does an anchor tenant actually drive?
The structural argument for anchor tenants is that they pull more visitors than any other store in the centre. To put a number on the asymmetry, we measured the average daily visitor count for anchor tenants against inline tenants across a sample of European centres instrumented by Ariadne.
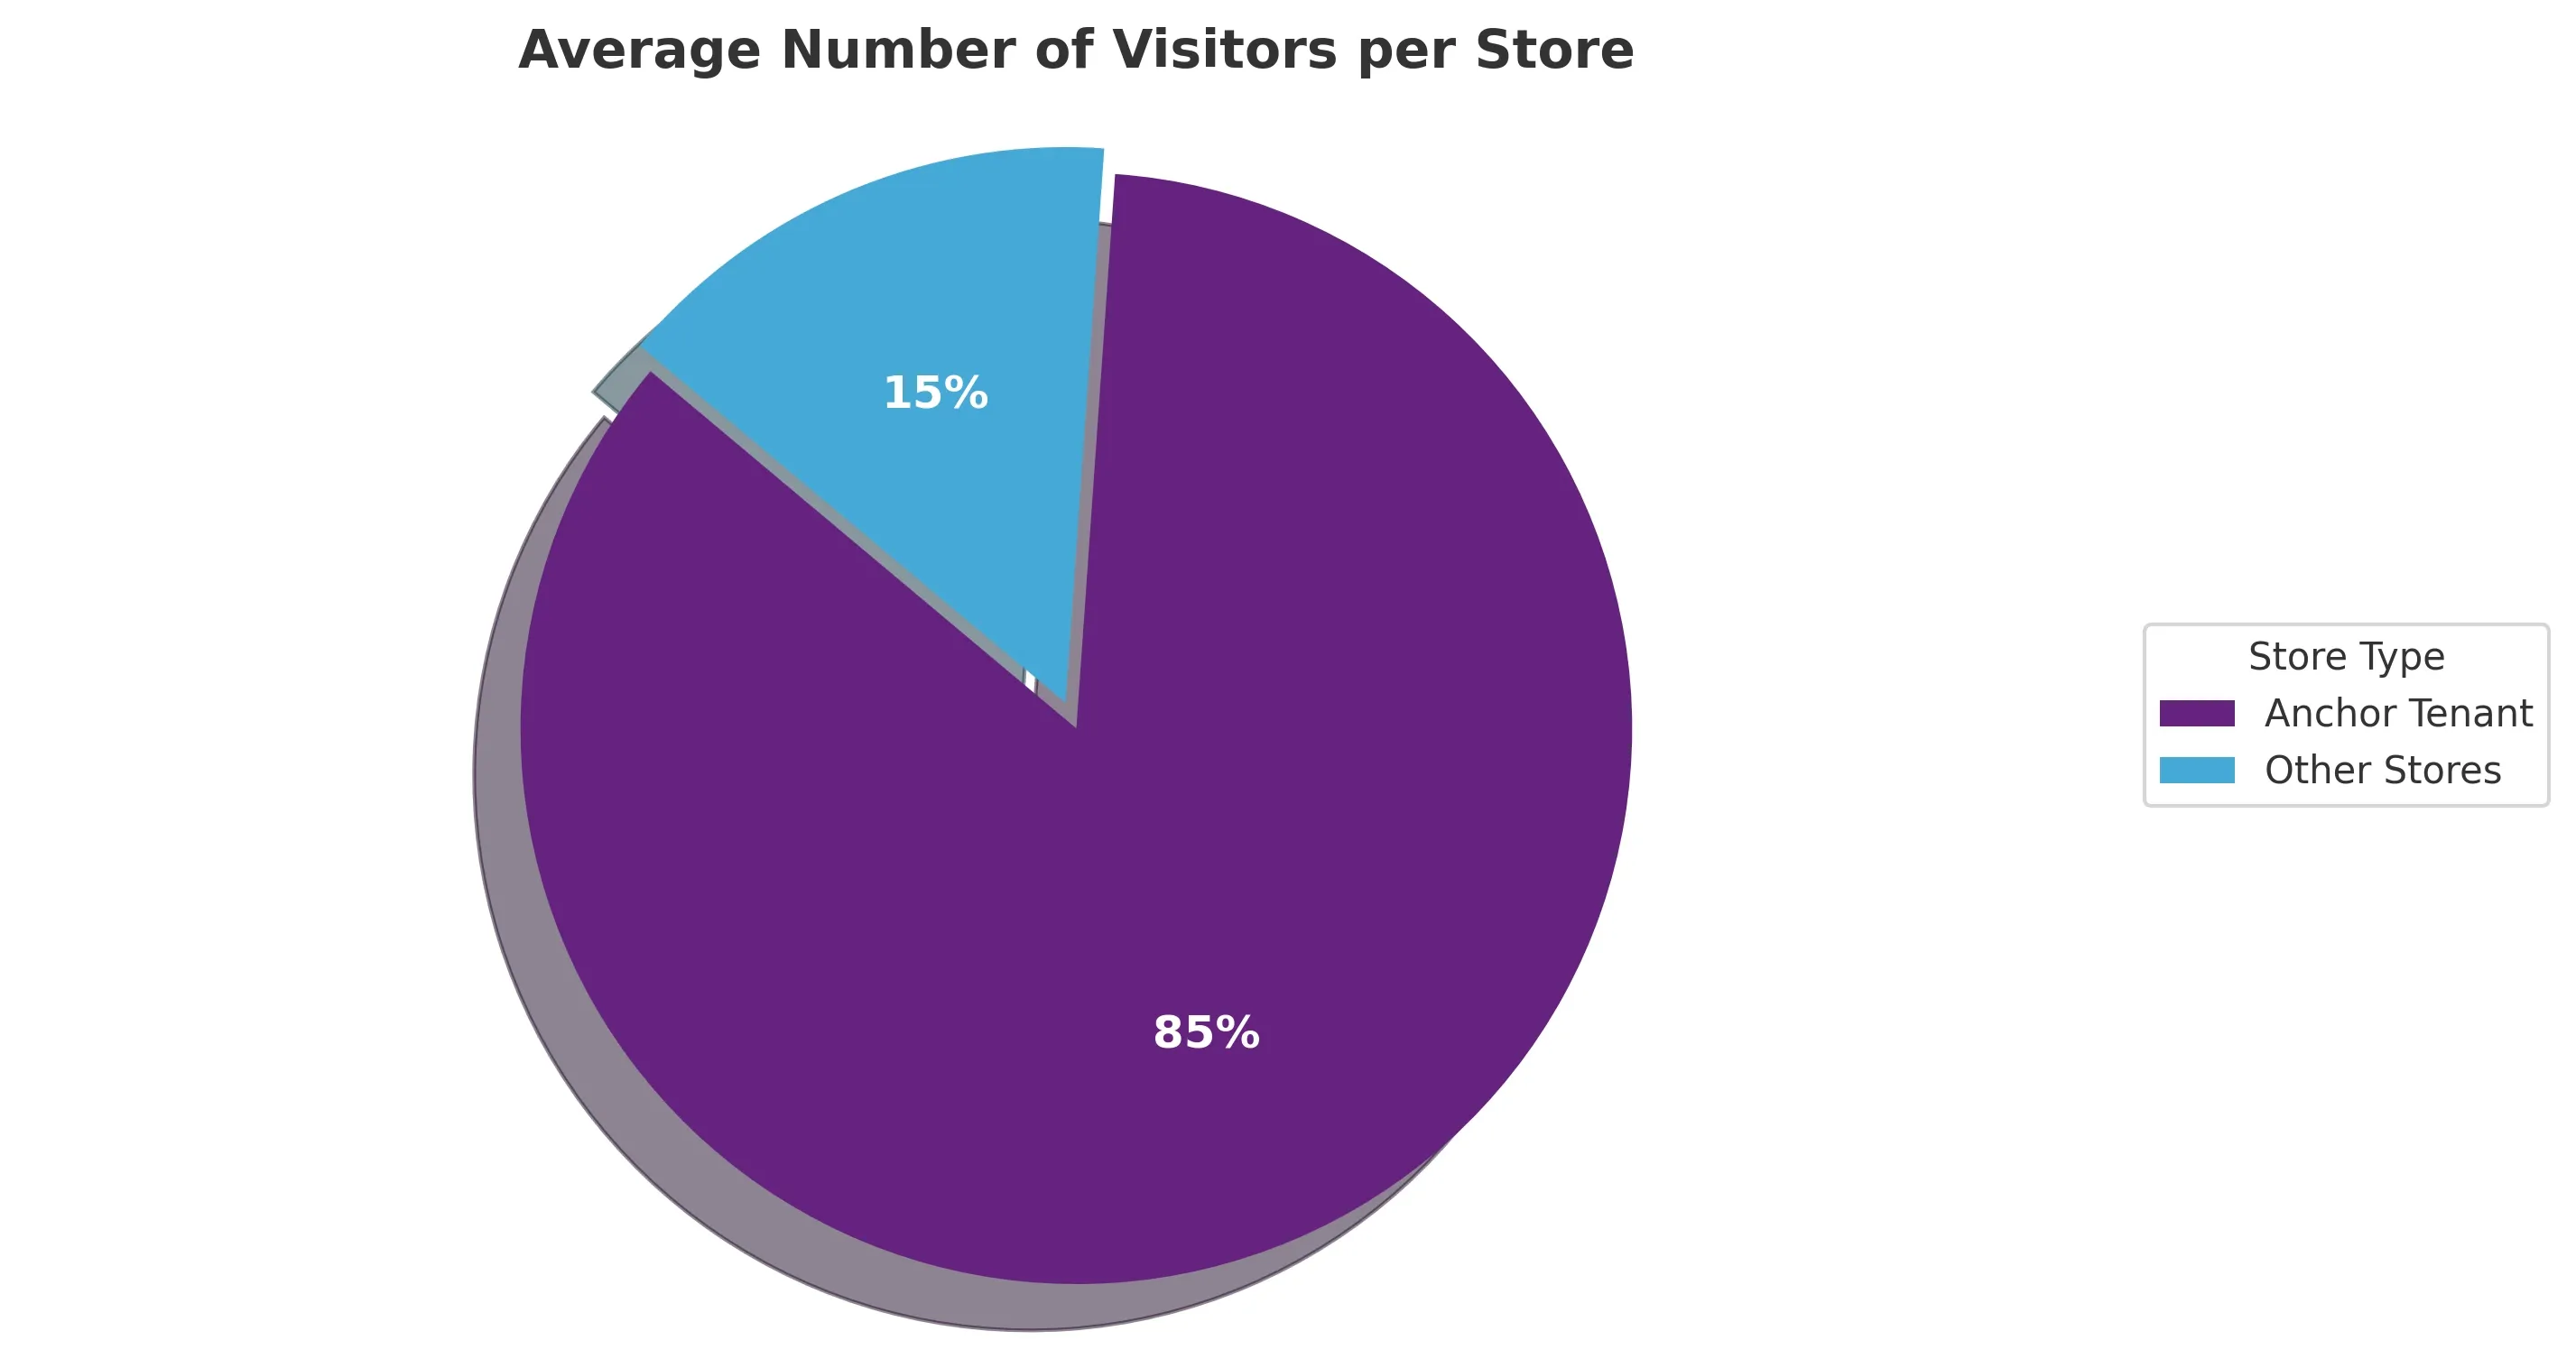
An anchor tenant attracts roughly 5 times more visitors than an average store in the same shopping centre. That asymmetry is the empirical case for the rent asymmetry: an anchor at one-tenth the inline rent per square metre still delivers five times the footfall, which means the anchor's effective rent per visitor is more than ten times more efficient for the landlord than an inline unit's. The lever is real, and it is the reason landlords keep granting anchor concessions even when the headline rent looks too low.
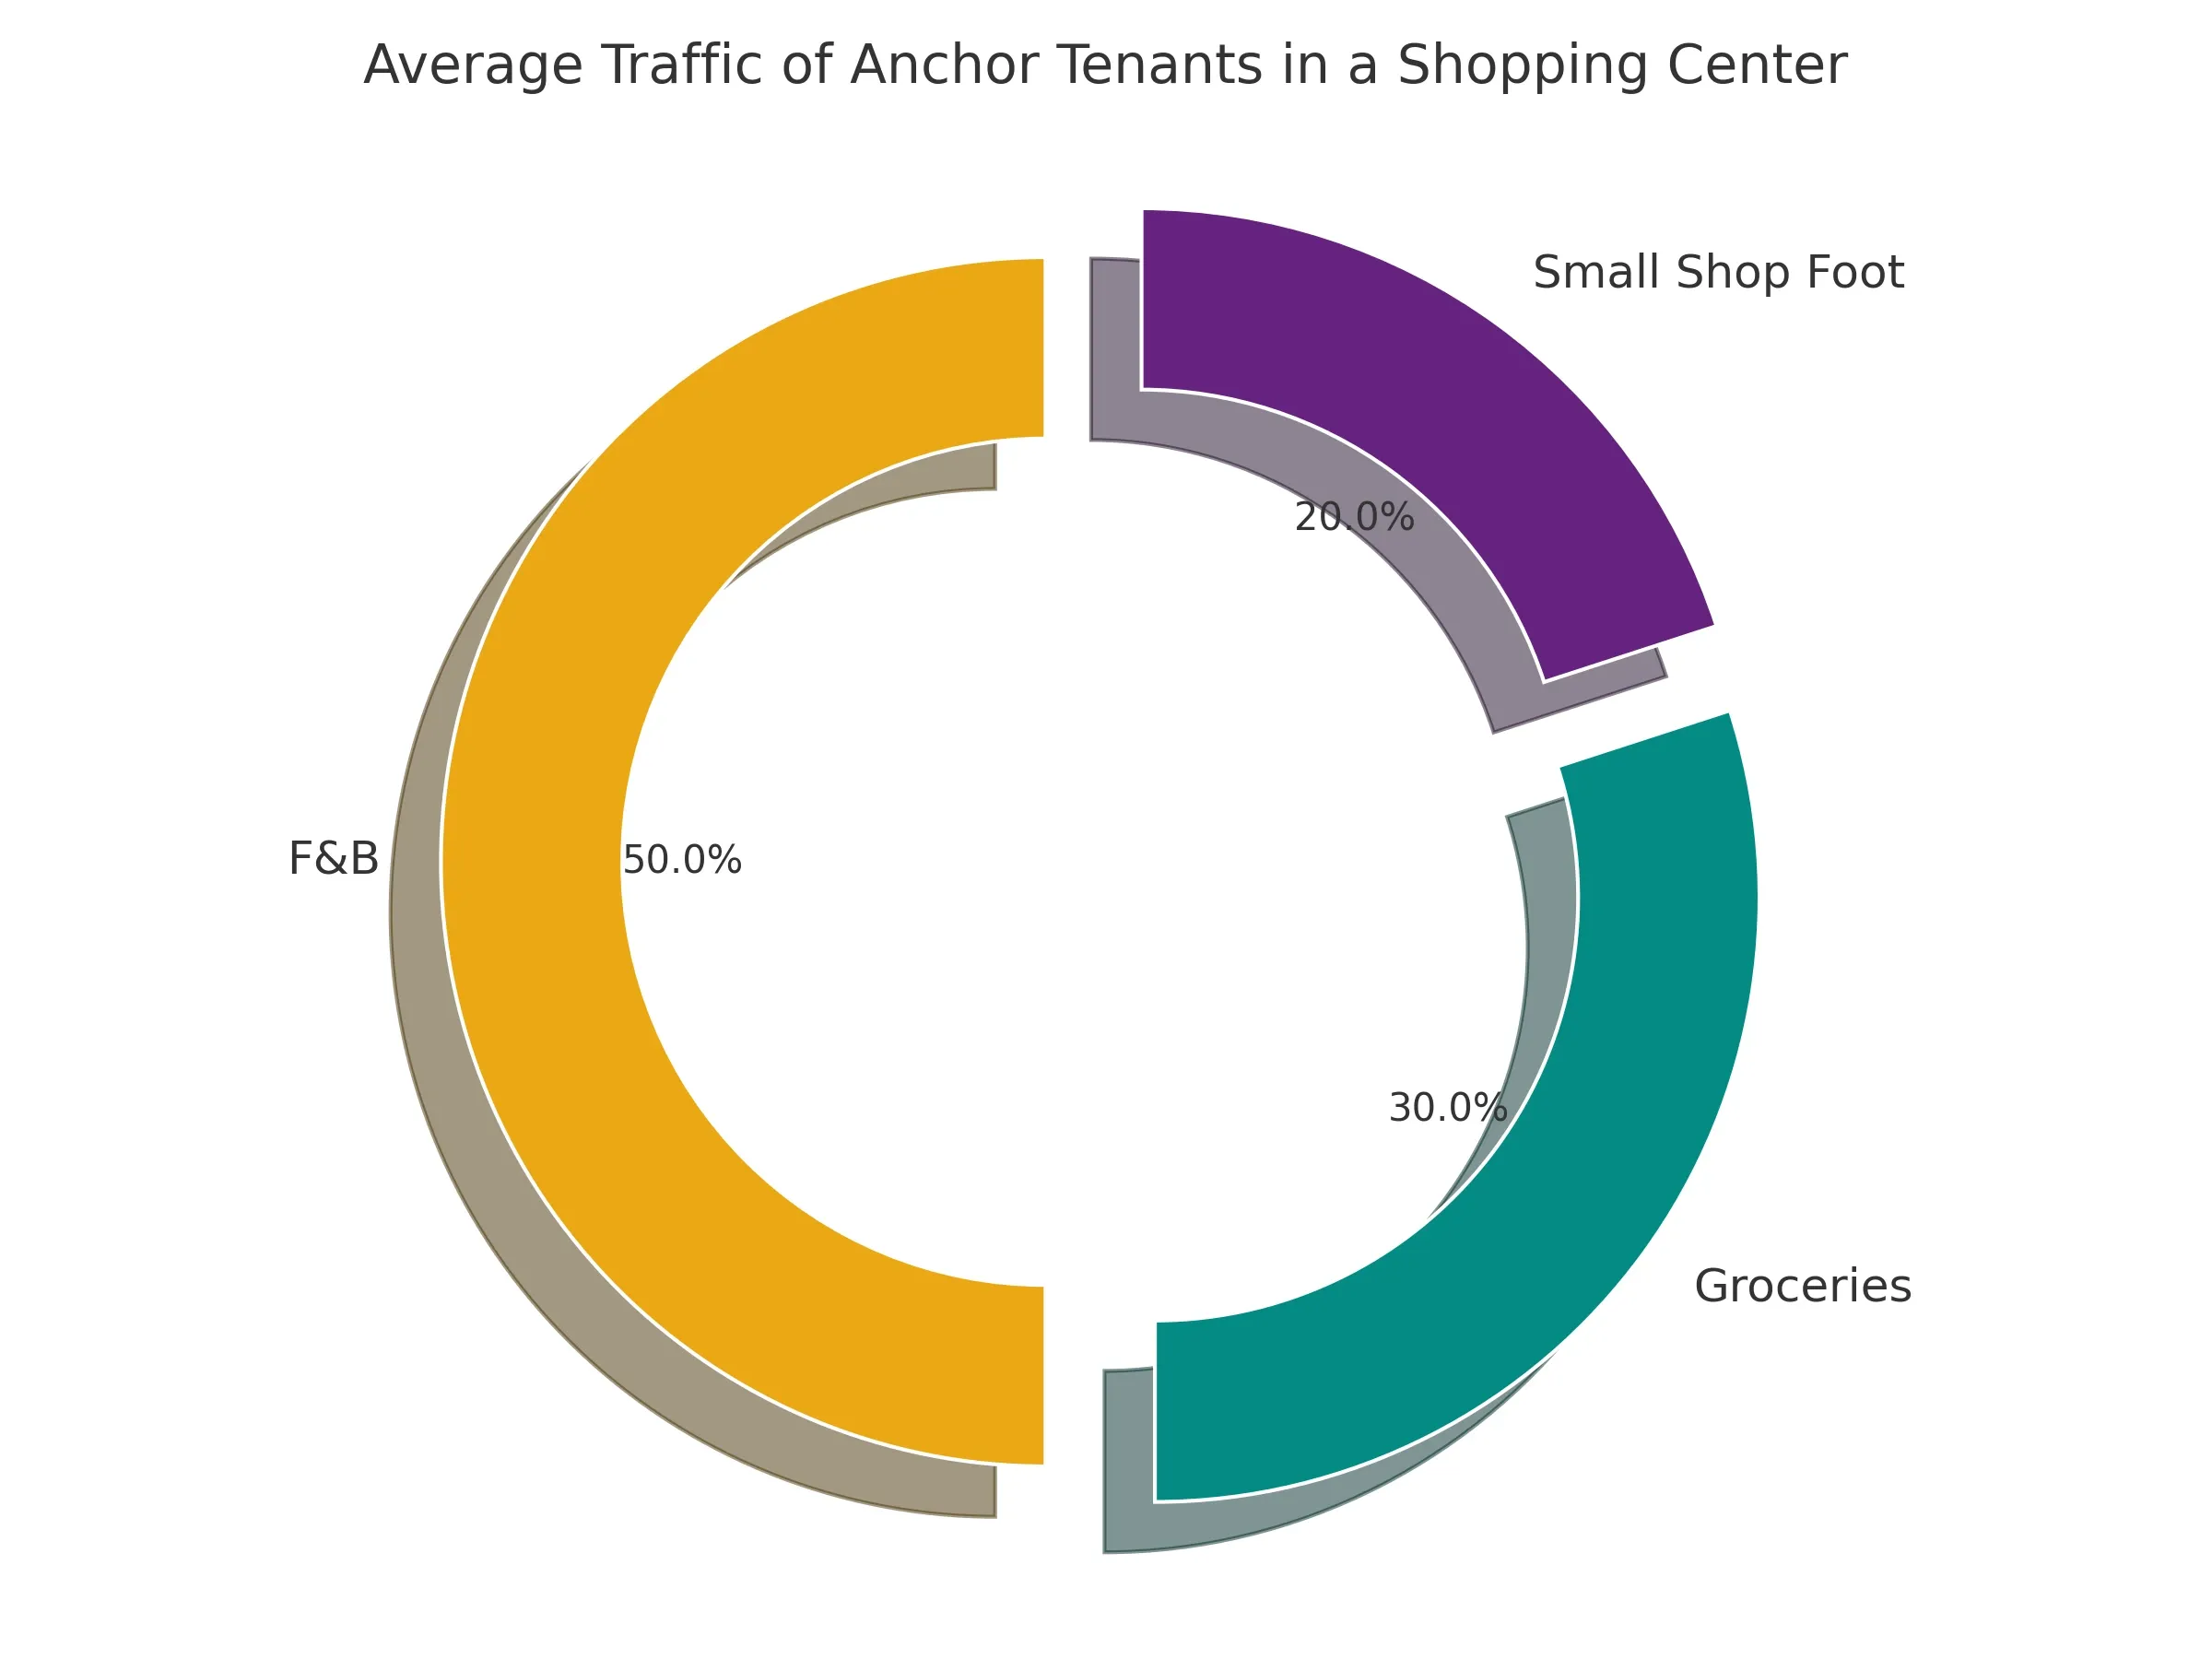
The footfall asymmetry also explains why anchor-vacancy losses cascade. When an anchor closes, the centre does not lose its own 5x share of visitors. It loses a fraction of every inline tenant's footfall too, because some inline visits depended on the anchor visit. Empirical estimates for that spill-over effect range from 8% to 25% of inline footfall depending on the centre's geometry and the inline tenant's location relative to the closed anchor. Tenants near the closed anchor lose the most.
The chart above shows the visitor-share decomposition between an anchor and its nearest inline neighbours across the same instrumented sample. The anchor's share dominates the daily total, and inline tenants' shares are visibly larger for the units closest to the anchor entrance.
The 2020-2025 decline of department-store anchors
The five years from 2020 to 2025 were the worst on record for traditional department-store anchors. The driver was not the pandemic alone but the structural mismatch between department-store economics and consumer behaviour that had been building since the mid-2010s. The pandemic accelerated what was already happening.
United States: Sears, JCPenney, Macy's
Sears Holdings, which once operated more than 3,500 stores, filed for Chapter 11 bankruptcy in October 2018 and emerged in 2019 with roughly 400 locations. By 2025 fewer than 15 Sears stores remained open. JCPenney filed for Chapter 11 in May 2020 and was acquired out of bankruptcy by Simon Property Group and Brookfield Asset Management in September 2020. Macy's announced in early 2024 that it would close 150 stores by 2026, roughly a third of its footprint. Each closure left a 10,000-square-metre hole in an American mall, and the co-tenancy clauses inside those leases triggered rent abatement claims from inline tenants.
Germany: Karstadt and Galeria
Karstadt and Kaufhof, merged in 2019 as Galeria Karstadt Kaufhof, filed for insolvency in April 2020 (Schutzschirmverfahren), again in October 2022, and a third time in January 2024. The 2024 filing closed 16 of the remaining 92 stores, including locations in Berlin, Essen and Wuppertal. By mid-2025 the chain had stabilised at around 70 stores, less than half its 2019 footprint. Each German closure freed 8,000 to 20,000 square metres of city-centre and regional-centre anchor space, and most landlords have been unable to backfill at comparable rent.
United Kingdom: Debenhams, House of Fraser, BHS
Debenhams entered administration in April 2020 and was liquidated in May 2021, closing all 124 UK stores. House of Fraser entered administration in 2018 and survived in a reduced 30-store form under Frasers Group. BHS had collapsed in 2016 with the loss of 11,000 jobs, and its 163 stores never fully backfilled. The UK department-store decline is the most advanced in Europe; few centres outside London now retain a traditional department-store anchor.
Pattern across markets
Three patterns repeat across the United States, Germany, the UK, France (where Galeries Lafayette and Printemps have closed regional stores), and Spain (where El Corte Inglés has consolidated to roughly 80 stores from a 2010 peak above 100). First, the anchor closures cluster in mid-market centres rather than top-tier ones. Second, backfill is structurally difficult because no comparable single-tenant retailer wants 10,000 square metres of mid-market space. Third, the centres that survive convert the anchor box into smaller units, often anchored by F&B, fitness or healthcare. The traditional anchor model is not coming back at scale.
Modern replacements: F&B, fitness, healthcare, coworking, entertainment
Centres that have backfilled vacated department-store anchors share a small set of replacement formats. None of them, on their own, generates the footfall of the original anchor; the modern strategy is to combine three or four smaller anchors that together replicate the traffic the old anchor produced, often with better dwell time and weekend pull than the original.
Food and beverage as the new dwell-time anchor
F&B was always a tenant category. After 2020 it became an anchor format in its own right. Food halls, market-hall concepts, and multi-restaurant clusters now occupy 1,500 to 4,000 square metres in centres that previously housed a single fashion anchor in the same footprint. Dwell time per visit doubles, and the F&B cluster pulls evenings and weekends, which traditional anchors did poorly.
Fitness and health clubs
Mid-market gyms (PureGym, FitX, McFit, Basic-Fit, Fitness First) sign 10 to 15 year leases on 1,500 to 3,000 square metres of mall space, typically on a basement or top floor that was hard to let to retail. Members visit two to four times per week, which gives the centre a captive recurring-visit base independent of seasonal retail patterns.
Healthcare and medical
Outpatient clinics, dental groups, diagnostic-imaging centres and pharmacies have moved into former anchor boxes in several German and Austrian centres. The visit frequency is lower than fitness but the dwell time is higher, and the demographic skew (older, more affluent) is complementary to the retail mix.
Coworking and flexible office
WeWork (in its post-bankruptcy form), Spaces, Mindspace, and regional brands have signed mall-anchor leases in mixed-use schemes. The model works best when the centre is in a transit-accessible location and the coworking floor sits above or adjacent to F&B. The Mall of Berlin and the BIKINI Berlin schemes both contain coworking components positioned as anchors.
Entertainment and family entertainment
Trampoline parks, indoor karting, escape-room clusters, climbing gyms, and family-entertainment-centre formats now anchor several regional centres in Europe. Cinema remains the largest entertainment-anchor format by floor area, but the post-2020 build-out is in shorter-format experiential venues that pull weekday-evening and weekend-afternoon traffic.
European examples
Designer Outlet centres in Germany illustrate the modern outlet-anchor model: the anchor is the brand-cluster, not a single retailer, and the centre's identity sits at the scheme level rather than at a tenant level. The Ö-Center near Vienna combines traditional fashion anchors with a strong F&B and family-leisure component. Schemes in Stuttgart and Frankfurt have backfilled vacated department-store anchors with combinations of grocery, fitness and entertainment rather than a single replacement. Smaller-town centres in Bernkastel-Kues, Fellbach, Leverkusen, Lörrach, Osnabrück and Deggendorf face the hardest backfill problem because their catchment areas do not support either a flagship F&B venue or a large fitness anchor at the rent levels needed.
Measuring anchor performance with footfall data
Most landlords still measure anchor performance through the anchor's own sales reports, filed monthly under the percentage-rent clause. That works for rent calculation but is the wrong lens for tenant-mix decisions, because it does not tell the landlord how much of the inline tenants' footfall the anchor is actually delivering. The right lens is sensor-level footfall that ties each anchor's daily visitor count to the inline tenants' visitor counts on the same day. For the technical setup, see footfall measurement for landlord reporting.
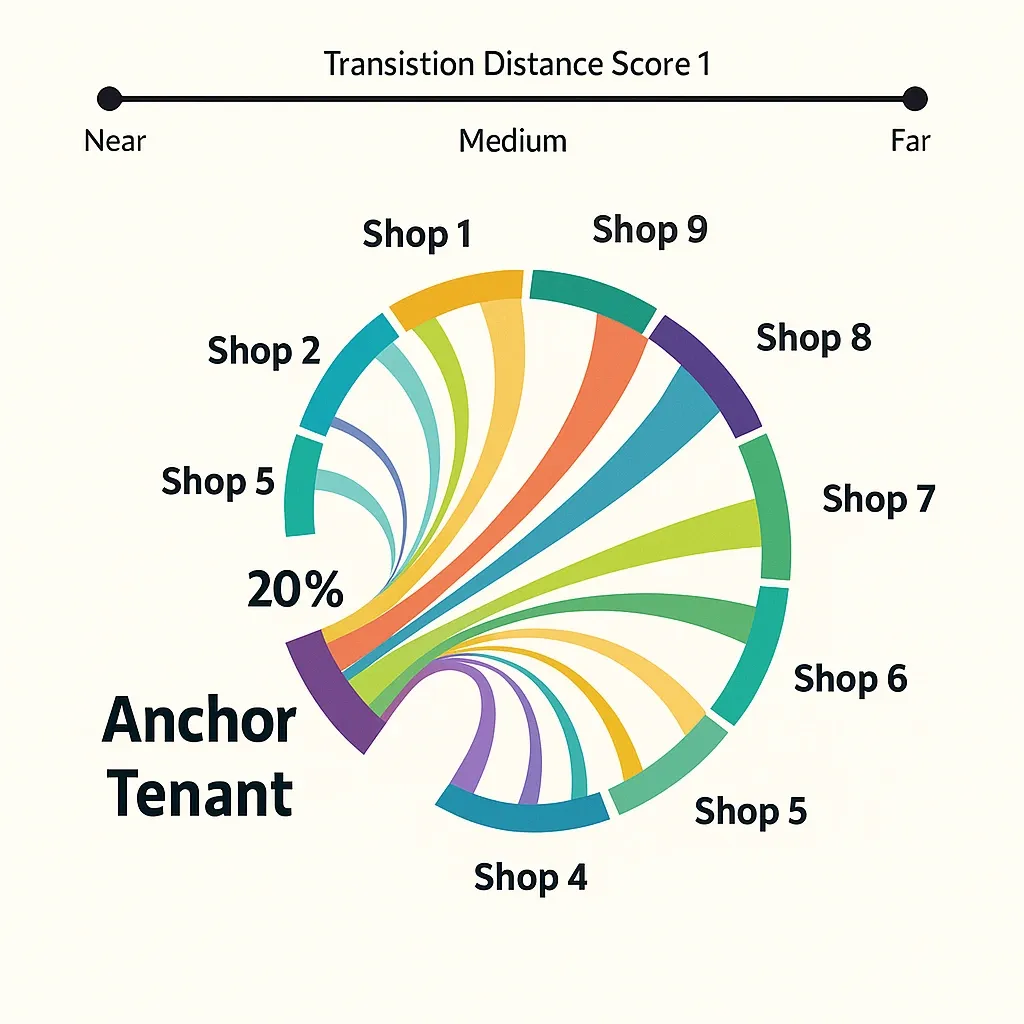
Three metrics matter at the centre level. First, anchor pull rate: the share of centre visitors who enter the anchor at all. A healthy grocery anchor sits at 35% to 55% pull rate; a department-store anchor in decline drops to 15% to 25% before the lease conversation gets serious. Second, anchor-to-inline cross-visit rate: the share of anchor visitors who also visit at least one inline tenant on the same trip. Healthy cross-visit rates run 40% to 65%; below 30%, the anchor is delivering footfall to itself and not to its neighbours. Third, inline tenant proximity uplift: the visitor lift each inline tenant receives from its distance to the anchor entrance. The closer to the anchor entrance, the higher the uplift; tenants more than 80 metres of corridor distance from the anchor typically receive no measurable anchor benefit.
Landlords who instrument these three metrics across their portfolio can renegotiate co-tenancy clauses with hard numbers, set rent steps for inline tenants based on actual proximity uplift, and identify backfill candidates whose pull-rate profile matches the lost anchor. For the cross-promotion mechanics that connect anchor traffic to inline tenants, see tenant cross-promotion.
What this means for shopping-centre operators in 2026
The anchor model is not dead. The traditional-department-store version of it is. Operators rebuilding a centre's anchor strategy in 2026 should plan around four constraints.
First, accept that a single 10,000-square-metre anchor is unlikely to be replaced by another single retailer at comparable rent. The market for that footprint has disappeared and is not returning. Plan for multi-anchor backfill at smaller individual footprints, typically a combination of grocery (if absent), F&B cluster, fitness and one experiential format.
Second, rebuild the co-tenancy clauses in inline leases against the new anchor mix. Co-tenancy clauses written against a single department-store anchor are unenforceable once that anchor is gone, but the inline tenants' rent expectations were set under the old clause. The renegotiation is uncomfortable and unavoidable.
Third, instrument the centre. Without footfall data at the sensor level, the operator is renegotiating leases on guesses. The shopping-centre operating model in 2026 assumes that pull-rate and cross-visit data is available daily, and the lease conversations that follow assume the same. Operators without that data are negotiating with one hand tied behind their back.
Fourth, plan for sequential exits. The first anchor to leave triggers co-tenancy claims that weaken the landlord's bargaining position with the second and third anchors. Operators who model the cascade in advance can sequence concessions and backfills to avoid losing rent on the inline tenants when the anchor mix changes. Operators who do not, lose income twice: once from the closed anchor and again from the inline tenants whose rent abatement clauses just triggered.
The anchor tenant is still the gravitational mass of the shopping centre. What has changed is what counts as mass. Grocery, F&B clusters, fitness and experiential formats now do the work that one department store used to do alone. Centres that adapt the leasing model to that reality will compound footfall through the rest of the decade. Centres that wait for a department store to call back will not.
Where to go from here
Operators rebuilding their anchor strategy with footfall data: Ariadne provides sensor-level visitor counts for shopping centres across Europe, covering pull rate, cross-visit rate, and inline proximity uplift in a single dashboard. For the platform overview, see footfall measurement for landlord reporting.