
A journey is a number sequence, if you pick the numbers
"Improve the customer journey" is a poster until it has KPIs. The physical journey compresses into six measurable families, each answering one question a store team actually argues about. This post defines each, names its trap, and links the deep dive.
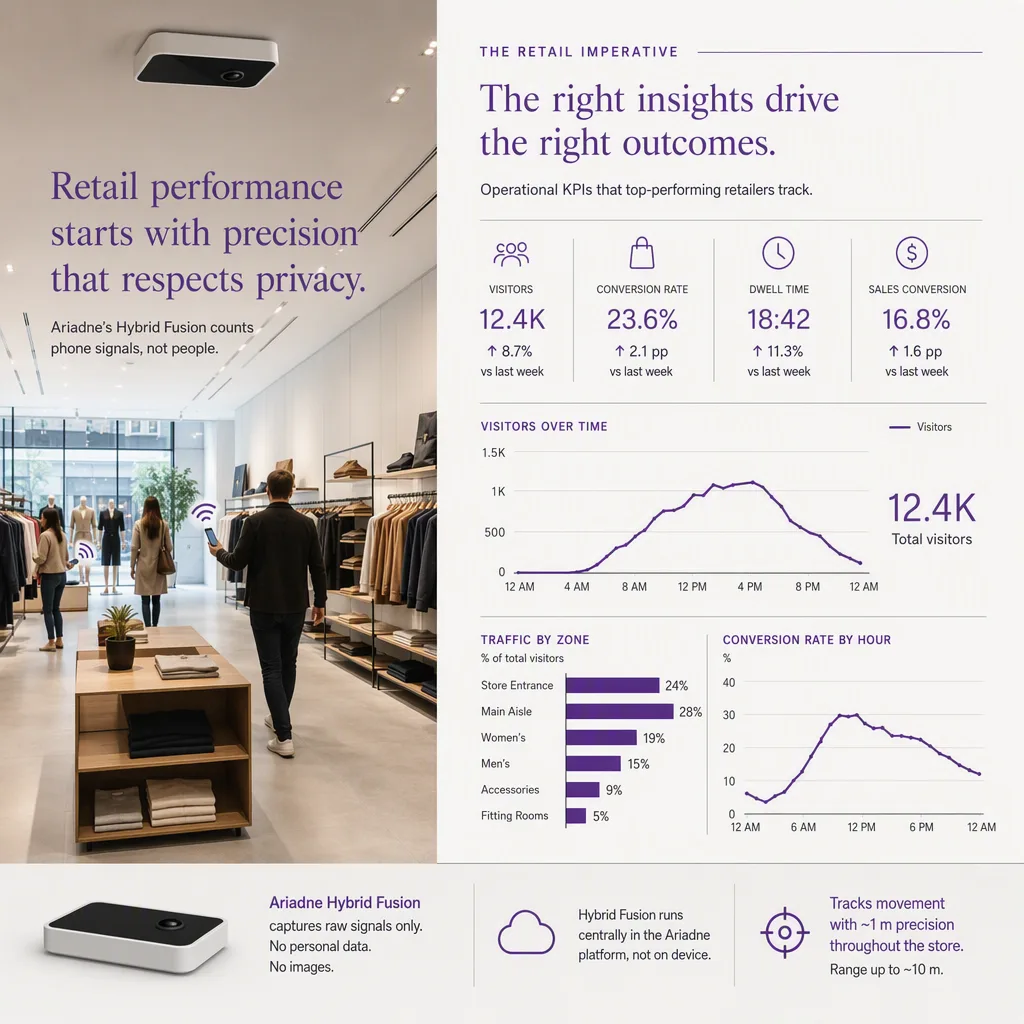
What are the main customer journey KPIs in physical retail?
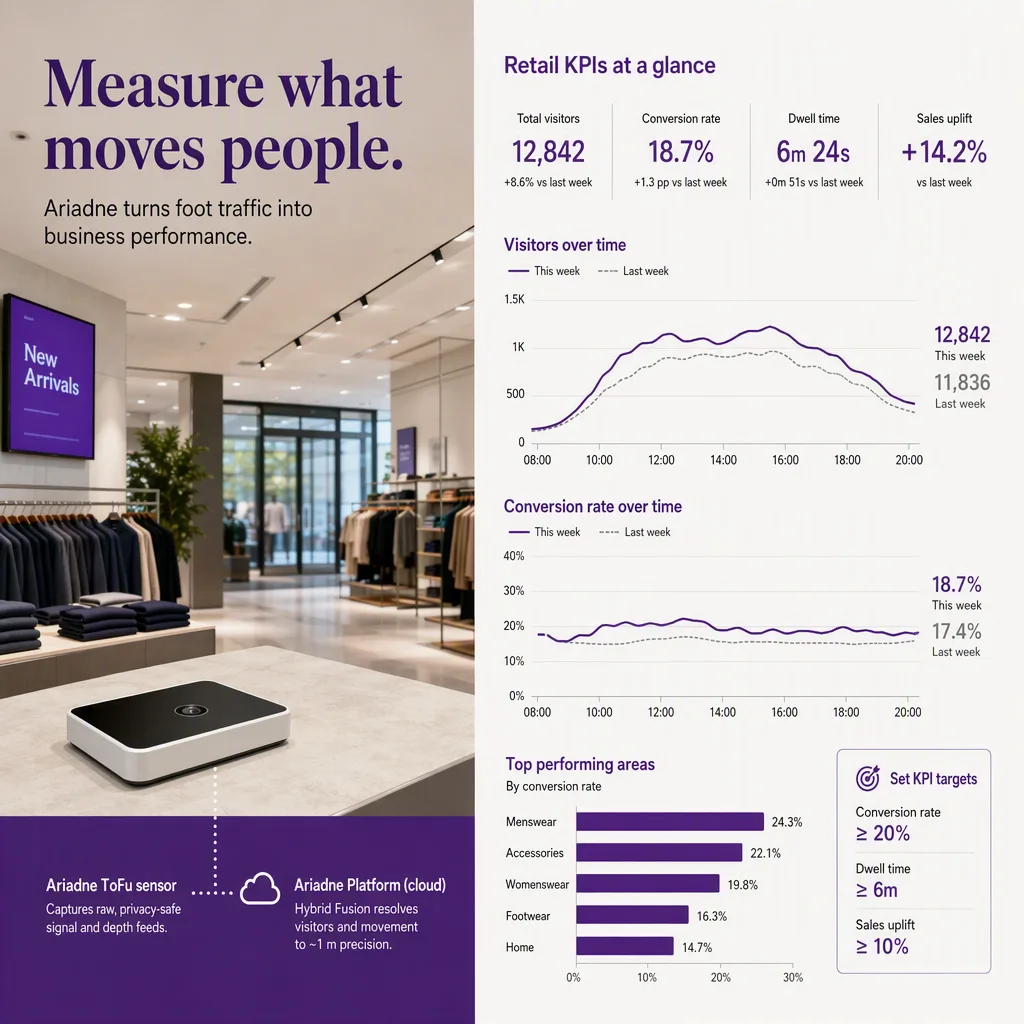
Capture (do passersby become visitors), reach (which zones a visit touches), dwell (how long, where), engagement (trial events: fitting rooms, demos, service contacts), conversion (visits that transact), and repeat (do journeys come back). Together they describe a visit end to end; individually each one can mislead, which is what the traps below are for.
The six families, with traps
- Capture rate. Entries over passing traffic: the storefront's KPI. Trap: capture without context; a rainy Saturday moves it more than a window change. Baseline against traffic curves (day-of-week footfall); definition and math in retail capture rate.
- Zone reach. Share of journeys entering each zone: the layout's KPI. Trap: confusing reach with value; a doormat zone everyone crosses is not a destination. Read reach against dwell.
- Dwell. Time in zone, the engagement precursor. Trap: averages; a mix of ten-second passes and five-minute settles averages into a meaningless number, so read distributions. Fundamentals in dwell time vs footfall.
- Engagement events. Vertical-specific trial moments (try-on, demo, consultation). Trap: measuring the event without the path to it; a low try-on rate can be a routing problem, not a product problem.
- Conversion. Transactions over visits. Trap: celebrating conversion lifts caused by traffic drops; the ratio rises when casual visitors stay home. Always read with absolute visits; formula and diagnostics in retail conversion rate.
- Repeat rate. Returning visit share, the loyalty proxy that needs no identity when measured as aggregate patterns. Method in repeat visit rate and visit frequency analysis.
One journey, one dashboard
The six families belong on one view in funnel order, because each stage's KPI is the next stage's denominator: capture feeds reach, reach feeds dwell, dwell feeds engagement, engagement feeds conversion, conversion feeds repeat. A store that reports them separately will optimize one stage against another; sequence them and the leak locates itself.
Where the numbers come from
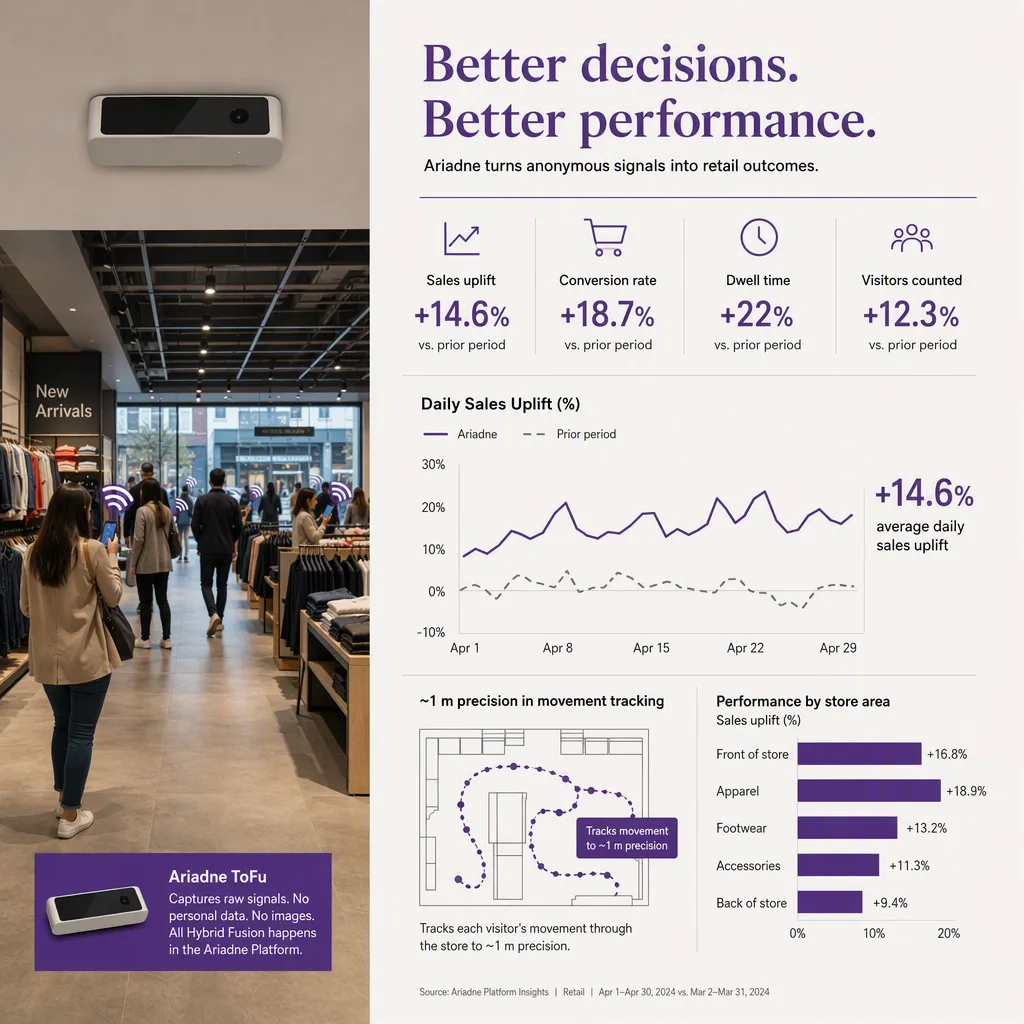
Every KPI above is derivable from anonymous journey measurement: entries, trajectories, per-zone dwell, and till data joined at the aggregate level. Ariadne supplies the journey side camera-free, which keeps the KPI stack inside privacy-by-construction territory. The method for building the underlying map is the pillar, customer journey mapping; the online-to-offline translation of these KPIs is in offline vs online customer journey.
# Program 3, Cluster 2 (Customer journey verticals) EN drafts: Part C (rows 229-232)
Status: EN drafts for review. Not pushed to CMS. No images, no DE yet.
Author: Govarthan.
---


